## Bar Chart: Hits@1 Comparison Between GoG and Graph-RFT Across IKG Thresholds
### Overview
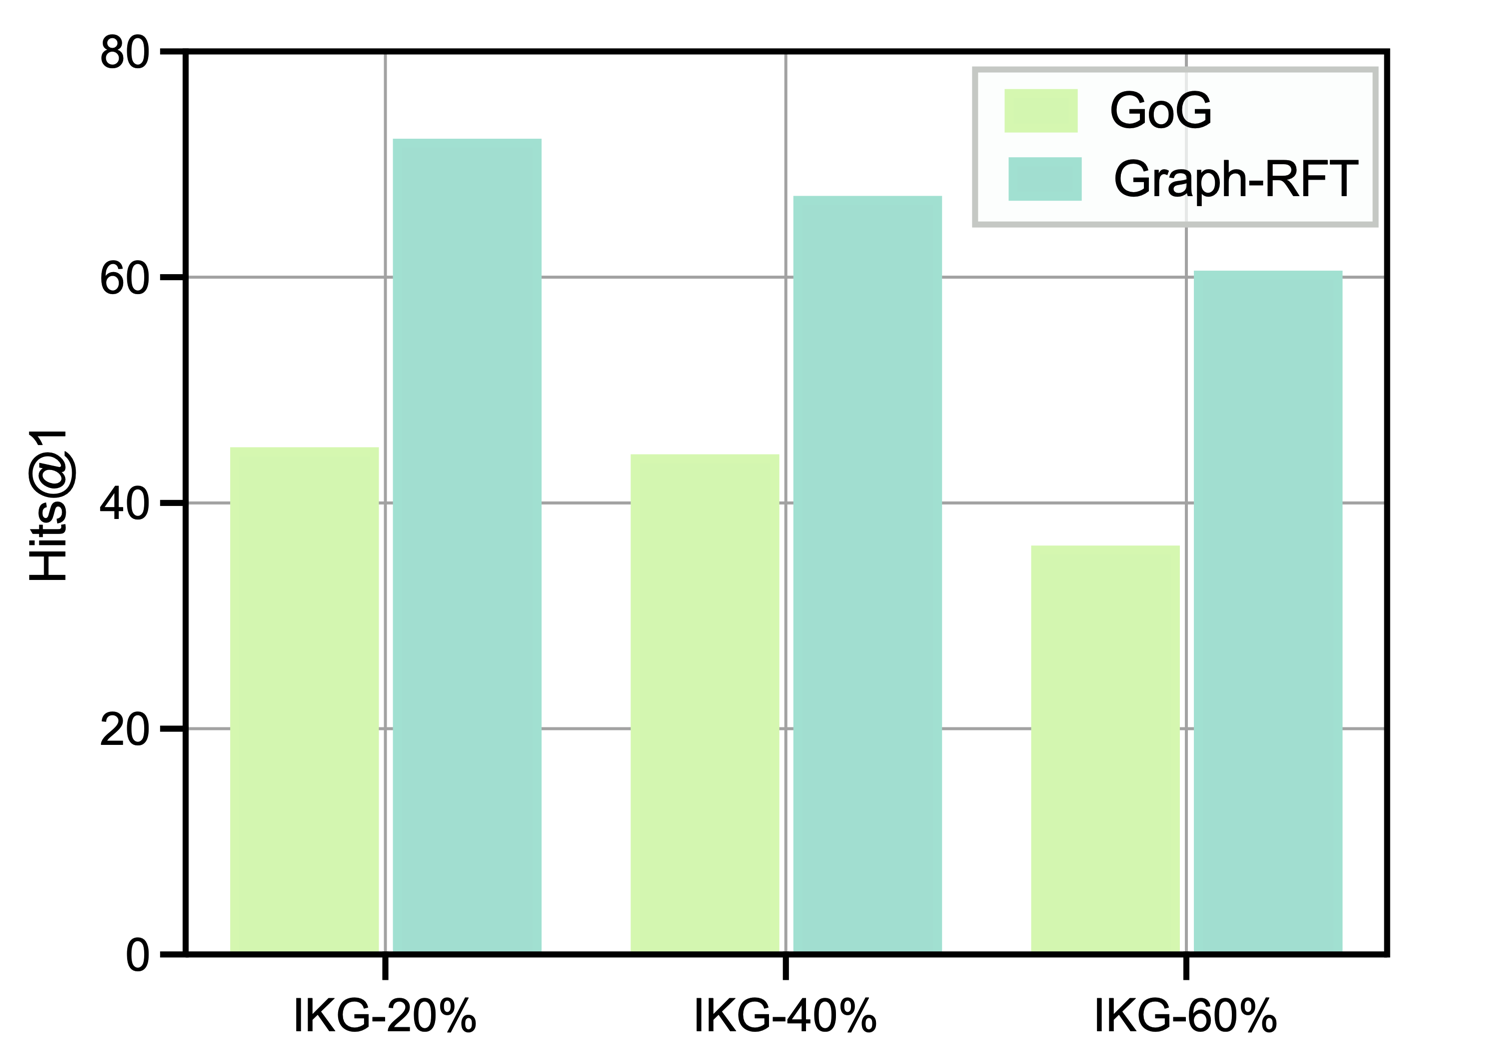
The chart compares the performance of two methods, **GoG** (light green bars) and **Graph-RFT** (teal bars), in terms of **Hits@1** metric across three IKG (Influence Knowledge Graph) thresholds: 20%, 40%, and 60%. The y-axis represents Hits@1 scores (0–80), while the x-axis categorizes data by IKG percentages.
---
### Components/Axes
- **Legend**: Located in the top-right corner, with:
- **GoG**: Light green (#e6f0d9)
- **Graph-RFT**: Teal (#a1de93)
- **X-axis**: Labeled "IKG-20%", "IKG-40%", "IKG-60%" (left to right).
- **Y-axis**: Labeled "Hits@1", scaled from 0 to 80 in increments of 20.
- **Bars**: Paired bars for each IKG category, with GoG on the left and Graph-RFT on the right.
---
### Detailed Analysis
1. **IKG-20%**:
- **GoG**: ~45 Hits@1 (light green bar height aligns with ~45 on y-axis).
- **Graph-RFT**: ~72 Hits@1 (teal bar height aligns with ~72 on y-axis).
2. **IKG-40%**:
- **GoG**: ~44 Hits@1 (slightly shorter than IKG-20%).
- **Graph-RFT**: ~67 Hits@1 (shorter than IKG-20% but still dominant).
3. **IKG-60%**:
- **GoG**: ~36 Hits@1 (notable drop from previous categories).
- **Graph-RFT**: ~60 Hits@1 (smallest drop among all categories).
---
### Key Observations
- **Graph-RFT consistently outperforms GoG** across all IKG thresholds, with a performance gap of ~27 Hits@1 at IKG-20% narrowing to ~24 Hits@1 at IKG-60%.
- **GoG shows a declining trend** as IKG increases (45 → 44 → 36), while **Graph-RFT declines more gradually** (72 → 67 → 60).
- The largest absolute difference occurs at IKG-20% (27 Hits@1), but the relative gap narrows slightly at higher IKG thresholds.
---
### Interpretation
The data suggests that **Graph-RFT is more robust or efficient** than GoG in handling IKG thresholds, particularly at higher IKG levels (60%). The narrowing performance gap at IKG-60% implies that Graph-RFT may scale better with increased complexity or noise in the IKG. GoG’s sharper decline at IKG-60% could indicate sensitivity to higher IKG densities or structural challenges in the graph. These trends highlight the importance of method selection based on IKG characteristics in applications like recommendation systems or knowledge graph analysis.