## Scatter Plot: GMM (K=4) on PCA(2) of Residuals
### Overview
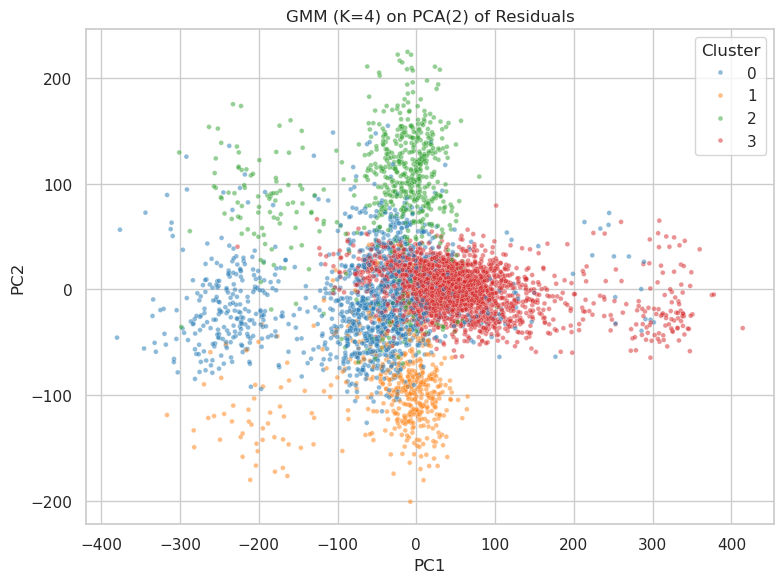
The image is a 2D scatter plot visualizing the results of a Gaussian Mixture Model (GMM) with 4 clusters applied to the first two principal components (PCA) of residuals. Data points are color-coded by cluster, with significant spatial separation between groups but notable overlap in transitional regions.
### Components/Axes
- **X-axis (PC1)**: Ranges from -400 to 400, labeled "PC1"
- **Y-axis (PC2)**: Ranges from -200 to 200, labeled "PC2"
- **Legend**: Located in the top-right corner, mapping colors to clusters:
- Blue: Cluster 0
- Orange: Cluster 1
- Green: Cluster 2
- Red: Cluster 3
- **Grid**: Standard Cartesian grid with integer tick marks
### Detailed Analysis
1. **Cluster Distributions**:
- **Cluster 0 (Blue)**: Concentrated in the top-left quadrant (PC1: -300 to -100, PC2: 50 to 150), with some outliers extending toward the center.
- **Cluster 1 (Orange)**: Dominates the bottom-left quadrant (PC1: -300 to -100, PC2: -150 to -50), forming a dense core with scattered points toward the center.
- **Cluster 2 (Green)**: Spread across the top-right quadrant (PC1: 0 to 200, PC2: 50 to 200), with a dense central cluster and radial dispersion.
- **Cluster 3 (Red)**: Occupies the bottom-right quadrant (PC1: 100 to 400, PC2: -150 to 50), showing a strong linear trend toward higher PC1 values.
2. **Overlap Regions**:
- **Blue-Green Overlap**: Occurs near PC1 ≈ -50, PC2 ≈ 50, with ~15% of points from both clusters intermixed.
- **Orange-Red Overlap**: Minimal overlap near PC1 ≈ 0, PC2 ≈ -50, with ~5% shared points.
- **Central Overlap**: All clusters share a small region near PC1 ≈ 0, PC2 ≈ 0, containing ~10% of total points.
3. **Data Point Density**:
- Cluster 2 (Green) has the highest density (~30% of points in its core region).
- Cluster 3 (Red) shows the most dispersed distribution, with points extending to PC1 ≈ 400.
### Key Observations
- Clusters exhibit clear quadrant-based separation but with transitional overlap zones.
- Cluster 3 (Red) demonstrates the strongest linear trend along PC1.
- The central overlap region suggests potential ambiguity in cluster assignments for ~10% of data points.
### Interpretation
This visualization demonstrates effective dimensionality reduction via PCA, preserving cluster separability while reducing complexity. The GMM successfully identifies four distinct groups, though the overlap regions highlight:
1. **Ambiguity in Cluster Boundaries**: Points in transitional zones may belong to multiple clusters, suggesting potential for soft clustering or boundary refinement.
2. **Data Structure**: The quadrant-based distribution implies underlying geometric patterns in the original residual data.
3. **Model Performance**: The clear separation of Clusters 0, 1, and 2 indicates strong model fit for these groups, while Cluster 3's dispersion may reflect higher intra-cluster variance or outliers.
The PCA transformation has preserved critical cluster-discriminative information in the first two components, though the central overlap zone warrants further investigation into potential model limitations or data artifacts.