## Scatter Plot: GMM (K=4) on PCA(2) of Residuals
### Overview
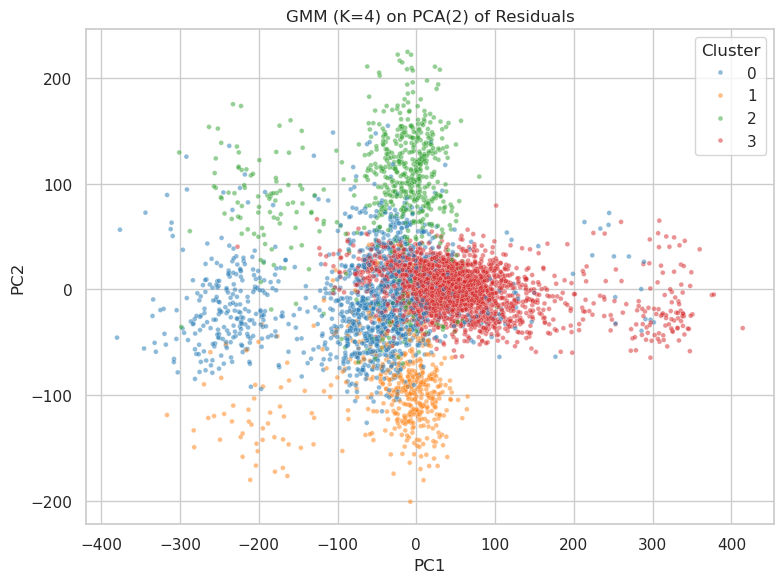
The image is a scatter plot visualizing the results of a Gaussian Mixture Model (GMM) with 4 clusters applied to the first two principal components (PCA(2)) of residuals. The plot displays data points colored according to their assigned cluster. The x-axis represents PC1, and the y-axis represents PC2.
### Components/Axes
* **Title:** GMM (K=4) on PCA(2) of Residuals
* **X-axis (PC1):** Ranges from approximately -400 to 400, with gridlines at intervals of 100.
* **Y-axis (PC2):** Ranges from approximately -200 to 200, with gridlines at intervals of 100.
* **Legend (Cluster):** Located in the top-right corner, indicating the cluster assignments:
* Cluster 0: Light Blue
* Cluster 1: Light Orange
* Cluster 2: Light Green
* Cluster 3: Light Red
### Detailed Analysis
* **Cluster 0 (Light Blue):** This cluster is spread across the plot, with a higher concentration of points between PC1 values of -250 and 0, and PC2 values of -50 and 50.
* **Cluster 1 (Light Orange):** This cluster is primarily located in the bottom-center of the plot, with PC1 values between -100 and 0, and PC2 values between -200 and -50.
* **Cluster 2 (Light Green):** This cluster is concentrated in the top-left quadrant, with PC1 values between -250 and -50, and PC2 values between 50 and 200.
* **Cluster 3 (Light Red):** This cluster is located in the top-right quadrant, with PC1 values between 0 and 200, and PC2 values between -25 and 50. There are also some points extending to PC1 values of approximately 400.
### Key Observations
* The clusters appear to be relatively well-separated, suggesting that the GMM was able to effectively partition the data.
* Cluster 3 (Light Red) has the highest concentration of points.
* Cluster 0 (Light Blue) is the most dispersed.
### Interpretation
The scatter plot visualizes the clustering of data points in a two-dimensional space defined by the first two principal components of the residuals. The GMM with K=4 has identified four distinct groups within the data. The positioning and density of each cluster provide insights into the underlying structure of the residuals after PCA. The plot suggests that the GMM was successful in identifying meaningful patterns in the data.