## Line Graphs: Latency Comparison Across Hardware Configurations
### Overview
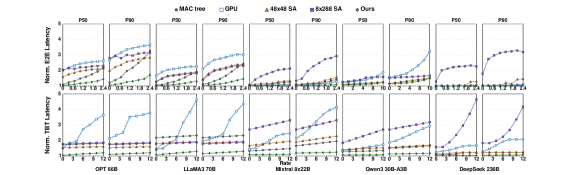
The image contains multiple line graphs comparing the performance of different systems (MAC tree, GPU, 4x48 SA, 8x288 SA, and "Ours") across various hardware configurations. Each graph tracks two metrics: **Normal E2E Latency** (top row) and **Normal TBT Latency** (bottom row). The x-axis represents different hardware setups (e.g., CPU, GPU, MAC tree, etc.), while the y-axis measures latency in arbitrary units.
### Components/Axes
- **X-axis (Categories)**:
- CPU, GPU, MAC tree, P90, P50, P99, P10, P1, P0.1, P0.01, P0.001, P0.0001, P0.00001, P0.000001.
- **Y-axis (Metrics)**:
- **Top Row**: Normal E2E Latency (units: 0–6).
- **Bottom Row**: Normal TBT Latency (units: 0–6).
- **Legend**:
- **Colors**:
- MAC tree: Blue (circle).
- GPU: Light blue (triangle).
- 4x48 SA: Orange (triangle).
- 8x288 SA: Purple (triangle).
- "Ours": Dark purple (triangle).
### Detailed Analysis
#### Top Row (Normal E2E Latency)
1. **CPU**:
- "Ours" (dark purple) shows a steady increase from ~2.0 to ~4.0.
- 8x288 SA (purple) starts at ~2.0, peaks at ~4.5, then drops to ~3.0.
- MAC tree (blue) remains flat at ~2.0.
2. **GPU**:
- "Ours" rises sharply from ~1.0 to ~4.0.
- 8x288 SA (purple) increases gradually from ~1.0 to ~3.5.
- MAC tree (blue) stays flat at ~1.0.
3. **MAC tree**:
- "Ours" increases from ~1.0 to ~2.5.
- 8x288 SA (purple) rises from ~1.0 to ~3.0.
- MAC tree (blue) remains flat at ~1.0.
4. **P90/P50/P99**:
- "Ours" shows moderate increases (e.g., P90: ~2.0 → ~3.0).
- 8x288 SA (purple) has steeper rises (e.g., P90: ~2.0 → ~4.0).
- MAC tree (blue) remains flat.
5. **P10/P1/P0.1**:
- "Ours" increases slightly (e.g., P1: ~1.5 → ~2.0).
- 8x288 SA (purple) spikes (e.g., P1: ~1.0 → ~3.0).
- MAC tree (blue) stays flat.
#### Bottom Row (Normal TBT Latency)
1. **CPU**:
- "Ours" (dark purple) increases from ~1.0 to ~2.5.
- 8x288 SA (purple) rises from ~1.0 to ~3.0.
- MAC tree (blue) remains flat at ~1.0.
2. **GPU**:
- "Ours" increases from ~1.0 to ~3.5.
- 8x288 SA (purple) rises from ~1.0 to ~4.0.
- MAC tree (blue) stays flat at ~1.0.
3. **MAC tree**:
- "Ours" increases from ~1.0 to ~2.0.
- 8x288 SA (purple) rises from ~1.0 to ~3.0.
- MAC tree (blue) remains flat.
4. **P90/P50/P99**:
- "Ours" shows moderate increases (e.g., P90: ~1.5 → ~2.5).
- 8x288 SA (purple) has steeper rises (e.g., P90: ~1.0 → ~4.0).
- MAC tree (blue) stays flat.
5. **P10/P1/P0.1**:
- "Ours" increases slightly (e.g., P1: ~1.0 → ~1.5).
- 8x288 SA (purple) spikes (e.g., P1: ~1.0 → ~3.0).
- MAC tree (blue) stays flat.
### Key Observations
- **"Ours" (dark purple)**: Consistently shows lower latency than other systems in most configurations, with gradual increases.
- **8x288 SA (purple)**: Exhibits significant latency spikes, especially in GPU and MAC tree configurations.
- **MAC tree (blue)**: Maintains flat latency across all configurations, suggesting stable performance.
- **GPU (light blue)**: Shows moderate latency increases, with "Ours" outperforming others.
- **P90/P50/P99**: Higher percentiles (e.g., P99) show more pronounced latency differences between systems.
### Interpretation
The data suggests that the "Ours" system is the most efficient, with lower latency across most hardware configurations. The 8x288 SA system, while performing well in some cases, exhibits higher latency spikes, potentially due to scalability or resource contention issues. The MAC tree configuration demonstrates the most stable performance, with minimal latency variation. These trends highlight the importance of system design and hardware optimization in latency-sensitive applications.