## Heatmap: P99 E2E Latency vs. Batch Size and Window Size
### Overview
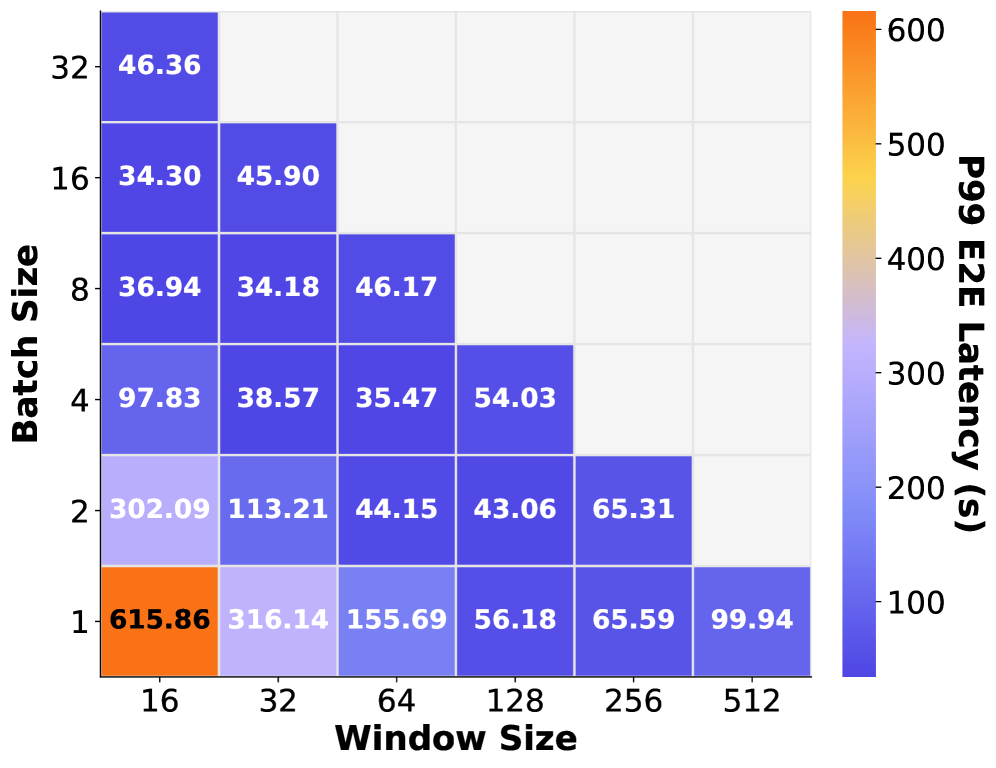
The image is a heatmap displaying the p99 end-to-end (E2E) latency in seconds for different combinations of batch sizes and window sizes. The x-axis represents the window size, and the y-axis represents the batch size. The color of each cell in the heatmap corresponds to the latency value, with a color scale ranging from blue (low latency) to orange (high latency). The heatmap is triangular, indicating that not all combinations of batch size and window size were tested.
### Components/Axes
* **X-axis:** Window Size, with values 16, 32, 64, 128, 256, and 512.
* **Y-axis:** Batch Size, with values 1, 2, 4, 8, 16, and 32.
* **Color Scale (Legend):** Located on the right side of the heatmap. It represents the p99 E2E latency in seconds, ranging from approximately 100 (blue) to 600 (orange). The scale has markers at 100, 200, 300, 400, 500, and 600.
* **Data Values:** Numerical values are displayed within each cell of the heatmap, representing the p99 E2E latency for the corresponding batch size and window size.
### Detailed Analysis
The heatmap presents latency values for various batch size and window size combinations. The data is structured as follows:
| Batch Size | Window Size 16 | Window Size 32 | Window Size 64 | Window Size 128 | Window Size 256 | Window Size 512 |
| :---------- | :------------- | :------------- | :------------- | :-------------- | :-------------- | :-------------- |
| 32 | 46.36 | N/A | N/A | N/A | N/A | N/A |
| 16 | 34.30 | 45.90 | N/A | N/A | N/A | N/A |
| 8 | 36.94 | 34.18 | 46.17 | N/A | N/A | N/A |
| 4 | 97.83 | 38.57 | 35.47 | 54.03 | N/A | N/A |
| 2 | 302.09 | 113.21 | 44.15 | 43.06 | 65.31 | N/A |
| 1 | 615.86 | 316.14 | 155.69 | 56.18 | 65.59 | 99.94 |
**Observations:**
* **Batch Size 32:** Only one data point is available: 46.36 at Window Size 16.
* **Batch Size 16:** Two data points are available: 34.30 at Window Size 16 and 45.90 at Window Size 32.
* **Batch Size 8:** Three data points are available: 36.94 at Window Size 16, 34.18 at Window Size 32, and 46.17 at Window Size 64.
* **Batch Size 4:** Four data points are available: 97.83 at Window Size 16, 38.57 at Window Size 32, 35.47 at Window Size 64, and 54.03 at Window Size 128.
* **Batch Size 2:** Five data points are available: 302.09 at Window Size 16, 113.21 at Window Size 32, 44.15 at Window Size 64, 43.06 at Window Size 128, and 65.31 at Window Size 256.
* **Batch Size 1:** Six data points are available: 615.86 at Window Size 16, 316.14 at Window Size 32, 155.69 at Window Size 64, 56.18 at Window Size 128, 65.59 at Window Size 256, and 99.94 at Window Size 512.
### Key Observations
* The highest latency (615.86 s) occurs at Batch Size 1 and Window Size 16, indicated by the orange color.
* Generally, latency decreases as the window size increases for a given batch size.
* Latency tends to increase as the batch size decreases for a given window size.
* The lowest latency values are observed for larger batch sizes (e.g., 8, 16, 32) and larger window sizes (where available).
### Interpretation
The heatmap illustrates the relationship between batch size, window size, and p99 E2E latency. The data suggests that smaller batch sizes and smaller window sizes result in higher latencies. This is likely due to increased overhead associated with processing smaller chunks of data. As the window size increases, the latency generally decreases, indicating that processing larger windows of data is more efficient. The optimal configuration appears to be a balance between batch size and window size, where both are reasonably large to minimize latency. The missing data points indicate that certain combinations of batch size and window size were not tested, possibly due to practical limitations or resource constraints.