## Heatmap: P99 E2E Latency vs. Batch Size and Window Size
### Overview
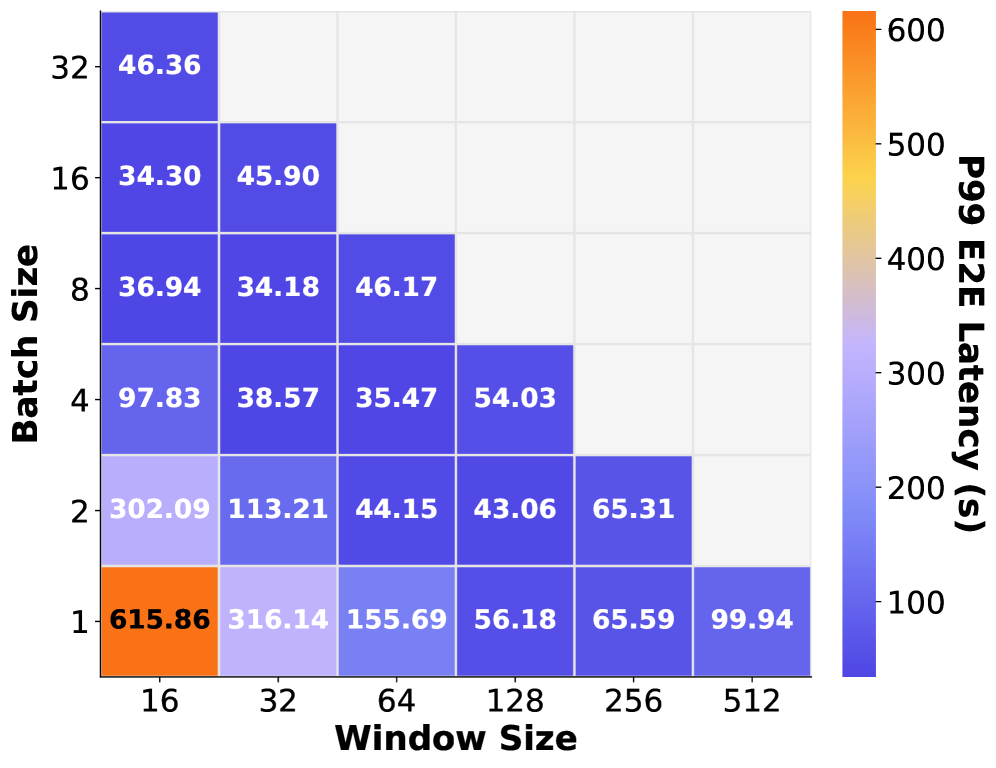
This image is a lower-triangular heatmap visualizing the P99 End-to-End (E2E) Latency (measured in seconds) across various combinations of "Batch Size" and "Window Size." The color scale ranges from dark blue (representing lower latency) to bright orange (representing higher latency). The data suggests an optimization problem where specific configurations of batch and window sizes significantly impact system performance.
### Components/Axes
* **Y-Axis (Vertical):** Labeled "Batch Size." The values are 1, 2, 4, 8, 16, and 32 (bottom to top).
* **X-Axis (Horizontal):** Labeled "Window Size." The values are 16, 32, 64, 128, 256, and 512 (left to right).
* **Legend:** Located on the right side. It maps color to "P99 E2E Latency (s)."
* **Range:** Approximately 100s (dark blue) to 600s+ (bright orange).
* **Data Grid:** A triangular matrix where each cell contains the specific P99 E2E Latency value.
### Detailed Analysis
The data is organized by Batch Size (rows) and Window Size (columns).
| Batch Size | Window 16 | Window 32 | Window 64 | Window 128 | Window 256 | Window 512 |
| :--- | :--- | :--- | :--- | :--- | :--- | :--- |
| **1** | 615.86 | 316.14 | 155.69 | 56.18 | 65.59 | 99.94 |
| **2** | 302.09 | 113.21 | 44.15 | 43.06 | 65.31 | - |
| **4** | 97.83 | 38.57 | 35.47 | 54.03 | - | - |
| **8** | 36.94 | 34.18 | 46.17 | - | - | - |
| **16** | 34.30 | 45.90 | - | - | - | - |
| **32** | 46.36 | - | - | - | - | - |
### Key Observations
* **Extreme Outlier:** The configuration of Batch Size 1 and Window Size 16 results in the highest latency (615.86s), which is significantly higher than any other data point.
* **Inverse Relationship (Batch Size):** Generally, as the Batch Size increases, the latency decreases significantly, particularly at smaller Window Sizes.
* **Diminishing Returns (Window Size):** Increasing the Window Size initially reduces latency (e.g., Batch 1: 615.86 -> 56.18), but there is a "U-shaped" trend in several rows. For example, in Batch 1, latency drops to 56.18 at Window 128, but then increases to 99.94 at Window 512.
* **Optimal Zone:** The "dark blue" region (lowest latency) is clustered around Batch Sizes 4, 8, and 16, with Window Sizes between 32 and 128. The absolute lowest value in the dataset is 34.18 (Batch 8, Window 32) and 34.30 (Batch 16, Window 16).
### Interpretation
This heatmap likely represents performance tuning for a data processing pipeline, such as a machine learning inference engine or a stream processing system.
* **System Overhead:** The high latency at low Batch/Window sizes (the orange/light blue cells) suggests that the system suffers from high overhead when processing small amounts of data at a time. This is typical of systems where the cost of initiating a task or context switching outweighs the actual processing time.
* **Throughput vs. Latency:** The "U-shaped" trend regarding Window Size suggests that while larger windows allow for better batching/parallelism (reducing latency), there is a tipping point where the window becomes too large, potentially causing memory pressure, cache misses, or increased processing time per window, leading to a latency regression.
* **Operational Recommendation:** To minimize P99 E2E latency, the system should avoid the "small batch/small window" configuration. The data indicates that a Batch Size of 8 or 16 combined with a Window Size of 16 to 64 provides the most stable and performant results.