\n
## Heatmap: P99 E2E Latency vs. Batch Size and Window Size
### Overview
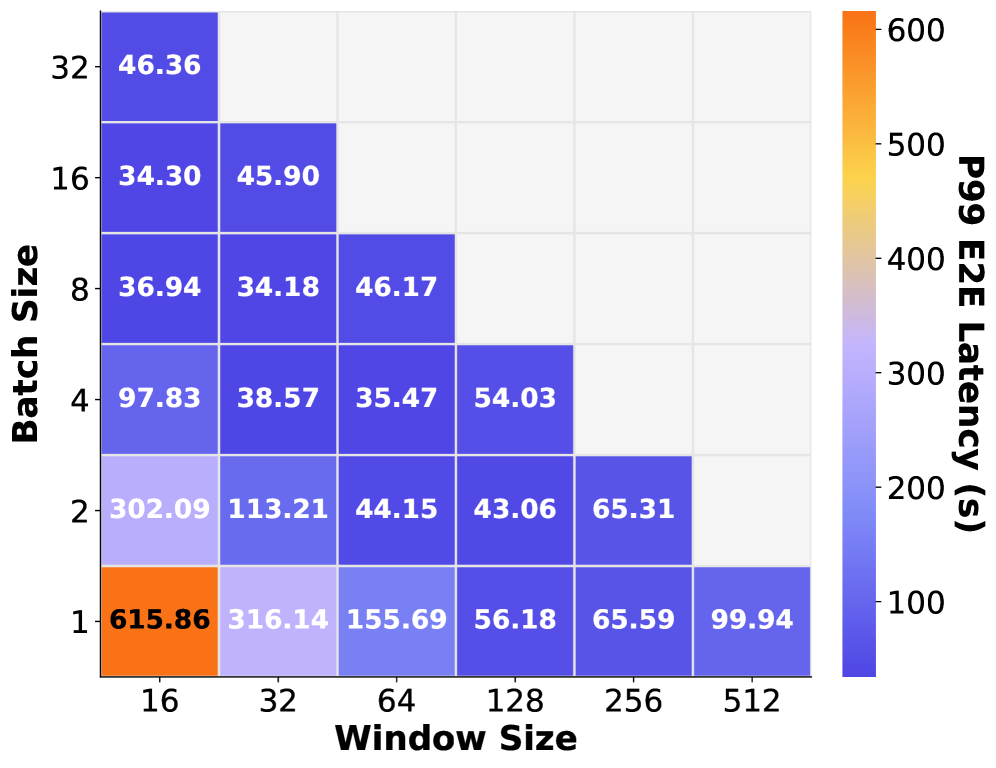
This image presents a heatmap visualizing the relationship between P99 End-to-End (E2E) Latency (in seconds) and two parameters: Batch Size and Window Size. The heatmap uses a color gradient to represent latency values, with warmer colors (orange/red) indicating higher latency and cooler colors (purple/blue) indicating lower latency.
### Components/Axes
* **X-axis:** Window Size, with values: 16, 32, 64, 128, 256, 512.
* **Y-axis:** Batch Size, with values: 1, 2, 4, 8, 16, 32.
* **Color Scale (Legend):** Located on the right side of the image. Represents P99 E2E Latency in seconds, ranging from approximately 100s (purple) to 600s (orange/red). The scale is linear.
* **Data Points:** Each cell in the heatmap represents a specific combination of Batch Size and Window Size, with the corresponding P99 E2E Latency value displayed within the cell.
### Detailed Analysis
The heatmap contains the following data points:
* **Batch Size 1:**
* Window Size 16: 615.86 seconds
* Window Size 32: 316.14 seconds
* Window Size 64: 155.69 seconds
* Window Size 128: 56.18 seconds
* Window Size 256: 65.59 seconds
* Window Size 512: 99.94 seconds
* **Batch Size 2:**
* Window Size 16: 302.09 seconds
* Window Size 32: 113.21 seconds
* Window Size 64: 44.15 seconds
* Window Size 128: 43.06 seconds
* Window Size 256: 65.31 seconds
* **Batch Size 4:**
* Window Size 16: 97.83 seconds
* Window Size 32: 38.57 seconds
* Window Size 64: 35.47 seconds
* Window Size 128: 54.03 seconds
* **Batch Size 8:**
* Window Size 16: 36.94 seconds
* Window Size 32: 34.18 seconds
* Window Size 64: 46.17 seconds
* **Batch Size 16:**
* Window Size 16: 34.30 seconds
* Window Size 32: 45.90 seconds
* **Batch Size 32:**
* Window Size 16: 46.36 seconds
**Trends:**
* For Batch Size 1, latency decreases significantly as Window Size increases from 16 to 128, then increases slightly at 256 and 512.
* For Batch Size 2, latency decreases as Window Size increases from 16 to 64, then remains relatively stable.
* For Batch Size 4, latency is relatively stable across all Window Sizes.
* For Batch Size 8, latency is relatively stable across all Window Sizes.
* For Batch Size 16 and 32, latency increases as Window Size increases.
### Key Observations
* The highest latency is observed at Batch Size 1 and Window Size 16 (615.86 seconds).
* The lowest latency is observed at multiple points, including Batch Size 4 and Window Size 64 (35.47 seconds).
* Latency generally decreases as Batch Size increases from 1 to 4, but then becomes more variable.
* There appears to be an optimal Window Size range (around 64-128) for minimizing latency, depending on the Batch Size.
### Interpretation
The heatmap demonstrates the trade-offs between Batch Size, Window Size, and P99 E2E Latency. A large Batch Size (1) combined with a small Window Size (16) results in significantly higher latency, likely due to increased processing overhead and queuing delays. Increasing the Window Size initially reduces latency, but beyond a certain point, it may start to increase it again, potentially due to increased memory usage or contention.
The data suggests that for optimal performance, a Batch Size of 4 or less, combined with a Window Size between 64 and 128, is preferable. The specific optimal configuration will depend on the system's resources and workload characteristics. The anomaly of increasing latency with larger window sizes for Batch Sizes 16 and 32 suggests a potential bottleneck or resource limitation that is exacerbated by larger window sizes. Further investigation would be needed to determine the root cause of this behavior.