TECHNICAL ASSET FINGERPRINT
d20d16915242d5d3aafbdc42
Click to view fullscreen
Press ESC or click to close
FOUND IN PAPERS
EXPERT: healer-alpha-free VERSION 1
RUNTIME: free/openrouter/healer-alpha
INTEL_VERIFIED
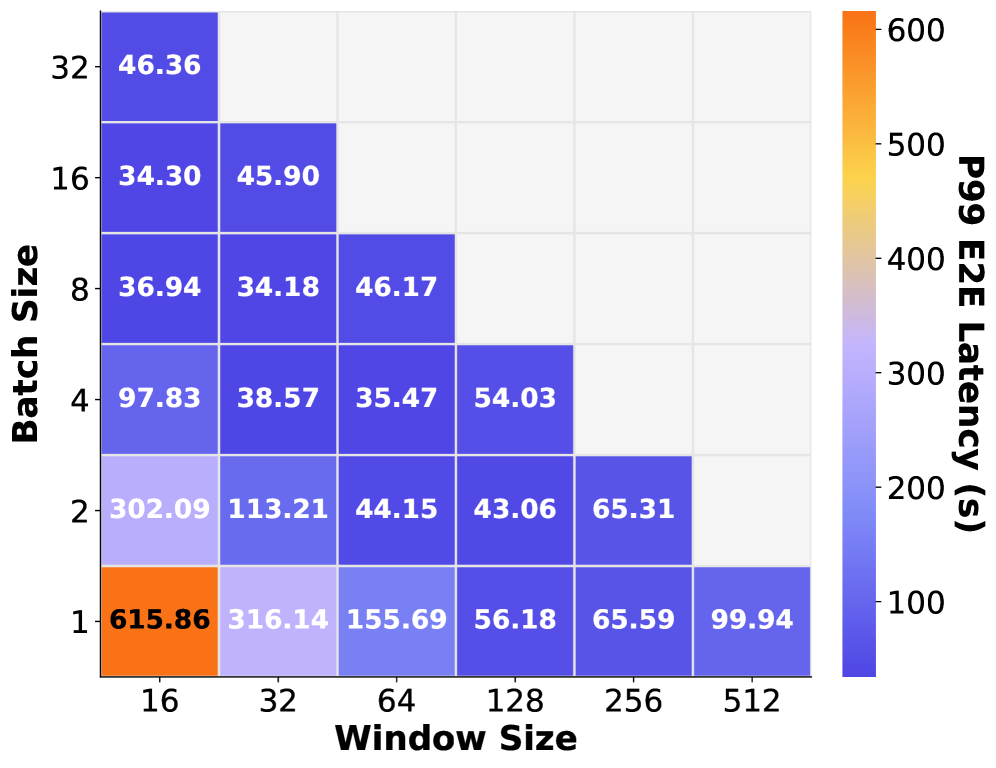
## Heatmap: P99 End-to-End Latency vs. Batch Size and Window Size
### Overview
This image is a heatmap chart visualizing the relationship between three variables: **Batch Size** (y-axis), **Window Size** (x-axis), and **P99 E2E Latency** in seconds (color intensity). The chart demonstrates how system latency (specifically the 99th percentile end-to-end latency) changes as the batch size and window size parameters are varied. The data forms a triangular pattern, with measurements provided only for specific combinations where the window size is greater than or equal to the batch size.
### Components/Axes
* **Chart Type:** Heatmap (2D grid with color-encoded values).
* **Y-Axis (Vertical):** Labeled **"Batch Size"**. The axis has discrete tick marks at values: **1, 2, 4, 8, 16, 32**. The axis is oriented with the smallest value (1) at the bottom and the largest (32) at the top.
* **X-Axis (Horizontal):** Labeled **"Window Size"**. The axis has discrete tick marks at values: **16, 32, 64, 128, 256, 512**. The axis is oriented with the smallest value (16) on the left and the largest (512) on the right.
* **Color Bar/Legend:** Positioned on the right side of the chart. It is a vertical gradient bar labeled **"P99 E2E Latency (s)"**. The scale runs from approximately **0** (dark blue) at the bottom to **600** (bright orange) at the top, with intermediate markers at **100, 200, 300, 400, 500**. The color gradient transitions from dark blue → light blue → lavender → light orange → bright orange.
* **Data Grid:** A 6x6 grid where each cell contains a numerical value representing latency. The grid is only partially filled, forming a lower-left triangular shape. Cells are colored according to the value they contain, matching the color bar scale.
### Detailed Analysis
The following table reconstructs the data from the heatmap. Each cell contains the **P99 E2E Latency (s)** value for the corresponding Batch Size (row) and Window Size (column). Cells marked "N/A" have no data in the chart.
| Batch Size \ Window Size | 16 | 32 | 64 | 128 | 256 | 512 |
| :----------------------- | :------ | :------ | :------ | :------ | :------ | :------ |
| **32** | 46.36 | N/A | N/A | N/A | N/A | N/A |
| **16** | 34.30 | 45.90 | N/A | N/A | N/A | N/A |
| **8** | 36.94 | 34.18 | 46.17 | N/A | N/A | N/A |
| **4** | 97.83 | 38.57 | 35.47 | 54.03 | N/A | N/A |
| **2** | 302.09 | 113.21 | 44.15 | 43.06 | 65.31 | N/A |
| **1** | 615.86 | 316.14 | 155.69 | 56.18 | 65.59 | 99.94 |
**Trend Verification & Spatial Grounding:**
* **Row (Batch Size = 1):** This row has the highest latency values and the most data points. The color transitions from bright orange (615.86 at Window Size 16) through lavender (316.14 at 32) to dark blue (99.94 at 512). The trend is a sharp decrease in latency as window size increases.
* **Row (Batch Size = 2):** Latency starts high (light lavender, 302.09 at Window Size 16) and decreases to a minimum (dark blue, 43.06 at Window Size 128) before a slight increase (dark blue, 65.31 at 256).
* **Rows (Batch Size 4, 8, 16, 32):** These rows contain fewer data points, limited to smaller window sizes. The values are generally lower (all colored dark blue, indicating < ~100s) and show less dramatic variation. For example, at Batch Size 8, latency fluctuates between 34.18 and 46.17 across window sizes 16, 32, and 64.
* **Column (Window Size = 16):** This column shows the most extreme variation. Latency decreases dramatically as batch size increases: from 615.86 (Batch 1) down to 34.30 (Batch 16). The color shifts from bright orange to dark blue.
* **General Pattern:** The highest latencies (orange/lavender cells) are concentrated in the bottom-left corner (low batch size, low window size). The lowest latencies (dark blue cells) are found in the upper rows and rightmost columns.
### Key Observations
1. **Extreme Outlier:** The single highest latency value is **615.86 seconds** at the combination of **Batch Size 1** and **Window Size 16**. This is the only cell colored bright orange.
2. **Triangular Data Mask:** Data is only provided where **Window Size ≥ Batch Size**. This creates a diagonal cutoff from the top-left to bottom-right of the grid.
3. **Non-Monotonic Trends:** The relationship is not perfectly linear. For instance, at Batch Size 2, latency dips at Window Size 128 (43.06) before rising again at 256 (65.31). Similarly, at Batch Size 8, latency is lowest at Window Size 32 (34.18).
4. **Diminishing Returns:** Increasing the batch size from 1 to 2 or 4 yields massive latency reductions (e.g., at Window Size 16: 615.86 → 302.09 → 97.83). However, further increases (e.g., from 8 to 16) show minimal or negative change.
### Interpretation
This heatmap illustrates a critical performance trade-off in a computational system, likely related to data processing, streaming, or machine learning inference. The **P99 E2E Latency** is a key metric for system reliability and user experience.
* **Core Finding:** The system exhibits **extremely high latency under conditions of minimal parallelism** (very small batch size) and **small processing windows**. This suggests significant per-request overhead that is not amortized when requests are processed individually or in tiny groups.
* **The Power of Batching:** The most effective strategy for reducing tail latency is to increase the **Batch Size**. Moving from processing items one-by-one (Batch Size 1) to even small batches (2 or 4) cuts latency by 50-85% in many cases. This indicates the system benefits greatly from vectorization, reduced context switching, or more efficient hardware utilization when handling multiple items simultaneously.
* **Role of Window Size:** Increasing the **Window Size** also generally reduces latency, but its effect is most pronounced at the smallest batch sizes. For larger batches (≥4), the impact of window size is less dramatic, and the optimal window size appears to be in the mid-range (64-128). The slight latency increase at the largest window size (512) for Batch Size 1 could indicate resource contention or overhead from managing very large data windows.
* **System Design Implication:** To achieve low and stable tail latency (P99), the system should be configured to operate with a **batch size of at least 4** and a **window size of 64 or larger**. Operating in the bottom-left region of this chart (Batch 1-2, Window 16-32) would result in poor and highly variable performance. The triangular data mask suggests that configurations where the batch size exceeds the window size may be invalid or untested for this system.
DECODING INTELLIGENCE...