## Heatmap: P99 End-to-End Latency (s) by Batch Size and Window Size
### Overview
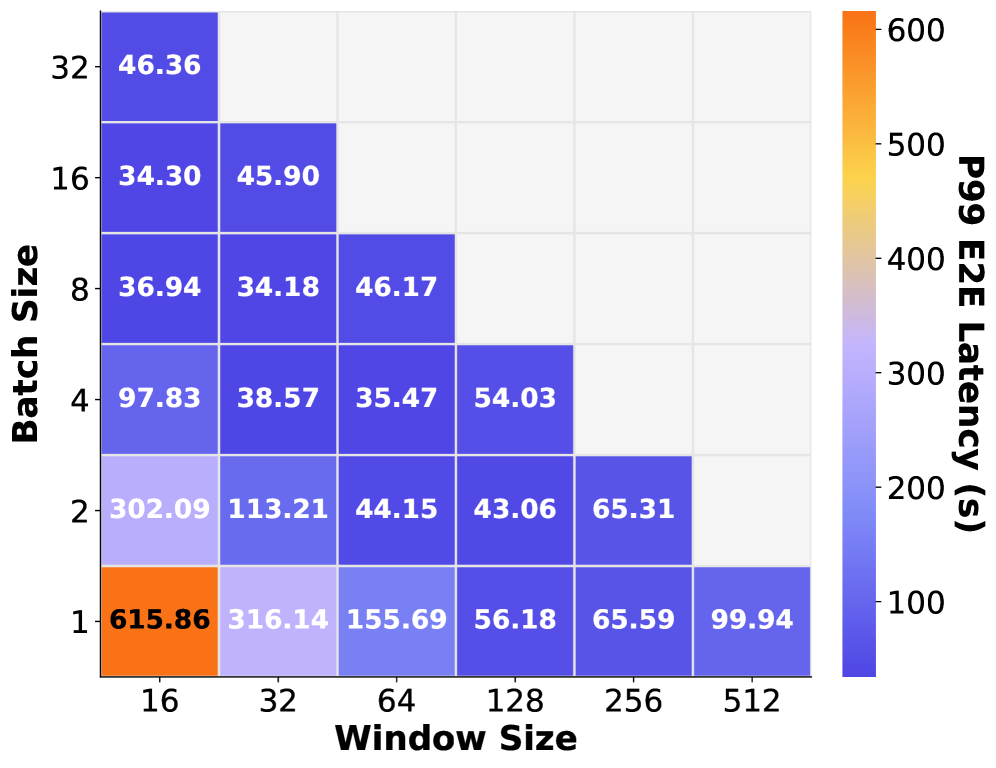
This heatmap visualizes the relationship between **batch size** (y-axis) and **window size** (x-axis) in terms of **P99 end-to-end latency** (color intensity and numerical values). Larger values (red) indicate higher latency, while smaller values (purple) indicate lower latency. The data suggests a complex interplay between batch and window sizes in determining system performance.
---
### Components/Axes
- **X-axis (Window Size)**: 16, 32, 64, 128, 256, 512
- **Y-axis (Batch Size)**: 1, 2, 4, 8, 16, 32
- **Color Scale (P99 E2E Latency)**:
- Purple (low latency, ~100s) to Red (high latency, ~600s)
- Legend positioned on the right side of the heatmap.
---
### Detailed Analysis
#### Numerical Values and Trends
1. **Batch Size = 32**
- Latency decreases with larger window sizes:
- 16 → 46.36s (purple)
- 32 → 45.90s (purple)
- 64 → 46.17s (purple)
- **Trend**: Stable, low latency across all window sizes.
2. **Batch Size = 16**
- Latency increases with window size:
- 16 → 34.30s (light purple)
- 32 → 45.90s (medium purple)
- 64 → 46.17s (medium purple)
- **Trend**: Slight upward trend.
3. **Batch Size = 8**
- Latency peaks at Window 64 (46.17s) and drops at larger windows:
- 16 → 36.94s (light purple)
- 32 → 34.18s (light purple)
- 64 → 46.17s (medium purple)
- **Trend**: Non-linear, with a peak at Window 64.
4. **Batch Size = 4**
- Latency increases with window size:
- 16 → 97.83s (medium blue)
- 32 → 38.57s (light blue)
- 64 → 35.47s (light blue)
- 128 → 54.03s (medium blue)
- **Trend**: U-shaped curve, with a dip at Window 64.
5. **Batch Size = 2**
- Latency increases with window size:
- 16 → 302.09s (dark blue)
- 32 → 113.21s (medium blue)
- 64 → 44.15s (light blue)
- 128 → 43.06s (light blue)
- 256 → 65.31s (medium blue)
- **Trend**: Sharp drop at Window 64, then gradual increase.
6. **Batch Size = 1**
- Latency peaks at Window 16 (615.86s, red) and decreases with larger windows:
- 16 → 615.86s (red)
- 32 → 316.14s (dark blue)
- 64 → 155.69s (medium blue)
- 128 → 56.18s (light blue)
- 256 → 65.59s (medium blue)
- 512 → 99.94s (light blue)
- **Trend**: Steep decline until Window 128, then slight increase.
---
### Key Observations
1. **Highest Latency**:
- **Batch 1, Window 16** (615.86s, red) — 6x higher than the next worst case (Batch 2, Window 16: 302.09s).
2. **Lowest Latency**:
- **Batch 32, Window 16** (46.36s, purple) — 13x lower than the highest value.
3. **Anomalies**:
- **Batch 2, Window 128** (43.06s) is lower than **Batch 2, Window 64** (44.15s), contradicting the general trend.
- **Batch 4, Window 128** (54.03s) is higher than **Batch 4, Window 64** (35.47s), suggesting inefficiencies at larger windows.
4. **Color-Value Mismatch**:
- The color scale (100–600s) does not align with the lowest value (46.36s), indicating a possible error in the legend or data.
---
### Interpretation
1. **Batch Size Impact**:
- Smaller batch sizes (e.g., 1, 2) exhibit significantly higher latency, likely due to increased overhead from processing fewer items per batch.
- Larger batches (e.g., 16, 32) show stable, low latency, suggesting efficient parallelization.
2. **Window Size Impact**:
- Larger window sizes generally increase latency, but the relationship is non-linear. For example:
- Batch 1 sees a 50% latency drop from Window 16 to 128.
- Batch 2’s latency drops sharply at Window 64 but rises again at 256.
3. **Anomalies Explained**:
- The dip in latency for **Batch 2, Window 128** (43.06s) may reflect optimized resource allocation at that specific configuration.
- The spike in **Batch 4, Window 128** (54.03s) could indicate memory or computational bottlenecks at larger windows.
4. **Legend Limitation**:
- The color scale (100–600s) fails to represent values below 100s (e.g., 46.36s), suggesting a misconfiguration in the visualization.
---
### Conclusion
The heatmap reveals that **batch size** has a more pronounced impact on latency than **window size**, with smaller batches causing exponential increases in latency. However, the non-linear trends and anomalies highlight the need for further investigation into system-specific optimizations (e.g., batch-window size interactions, resource allocation). The mismatch between the color scale and data values also warrants correction for accurate interpretation.