## Bar Chart: Number of Files per Category
### Overview
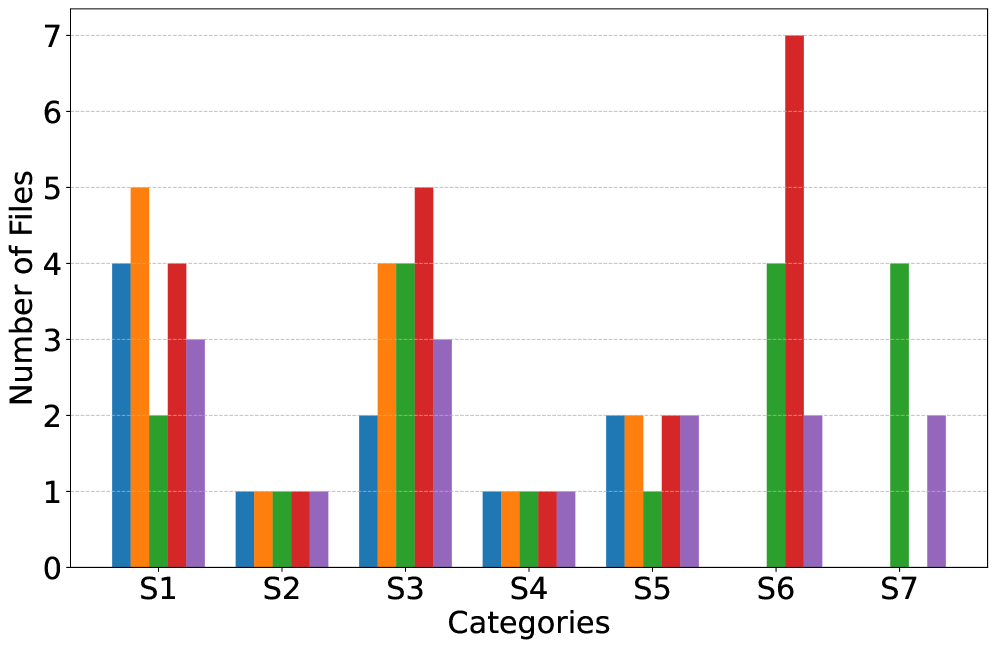
The image is a bar chart displaying the number of files across seven categories (S1 to S7). Each category has five bars of different colors, presumably representing different file types or sources. The y-axis represents the number of files, ranging from 0 to 7.
### Components/Axes
* **X-axis:** Categories (S1, S2, S3, S4, S5, S6, S7)
* **Y-axis:** Number of Files (ranging from 0 to 7, with gridlines at each integer value)
* **Bars:** Five bars per category, each with a distinct color (blue, orange, green, red, purple). The legend is missing, so the meaning of each color is unknown.
### Detailed Analysis
Here's a breakdown of the number of files for each category and color:
* **S1:**
* Blue: 4
* Orange: 5
* Green: 2
* Red: 4
* Purple: 3
* **S2:**
* Blue: 1
* Orange: 1
* Green: 1
* Red: 1
* Purple: 1
* **S3:**
* Blue: 2
* Orange: 4
* Green: 4
* Red: 5
* Purple: 3
* **S4:**
* Blue: 1
* Orange: 1
* Green: 1
* Red: 1
* Purple: 1
* **S5:**
* Blue: 2
* Orange: 2
* Green: 1
* Red: 2
* Purple: 2
* **S6:**
* Blue: 2
* Orange: 2
* Green: 4
* Red: 7
* Purple: 2
* **S7:**
* Blue: 1
* Orange: 1
* Green: 4
* Red: 1
* Purple: 2
### Key Observations
* Categories S2 and S4 have the lowest number of files across all colors, with each color having a value of 1.
* Category S6 has the highest number of files, primarily driven by the red bar, which reaches a value of 7.
* Category S7 has a relatively high number of green files (4).
* The distribution of files across colors varies significantly between categories.
### Interpretation
The bar chart provides a comparison of the number of files across different categories, broken down by color. Without a legend, it's impossible to determine what the colors represent (e.g., file types, sources, etc.). However, the chart highlights that categories S2 and S4 have the fewest files, while category S6 has a significantly higher number of files, particularly in the red category. The data suggests that there are notable differences in file distribution across the categories. Further interpretation requires knowing what the colors represent.