## Bar Chart: File Counts by Category
### Overview
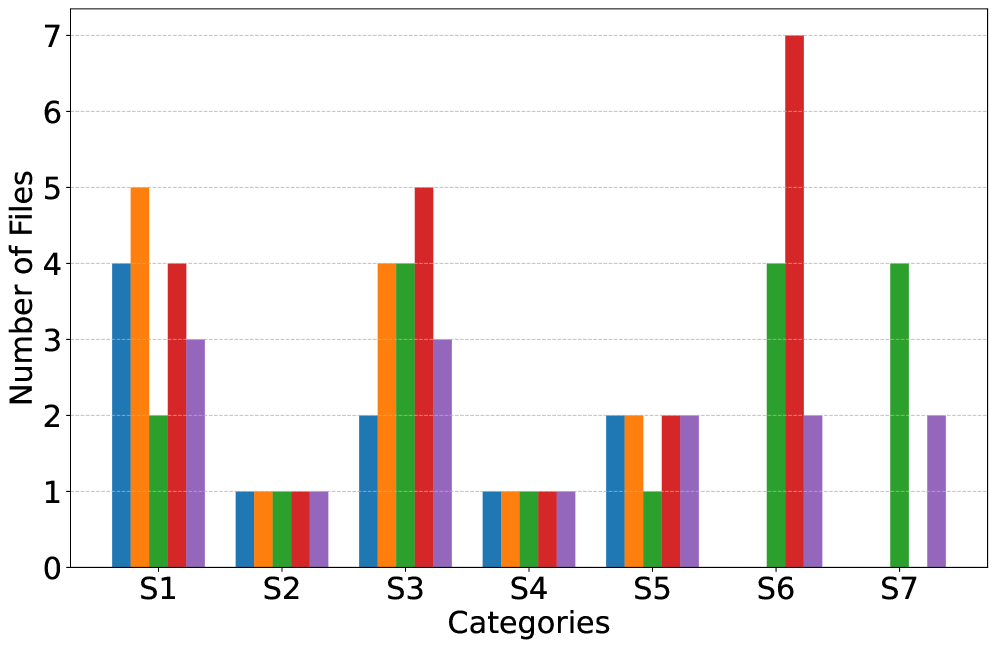
This is a grouped bar chart displaying the "Number of Files" across seven distinct categories labeled S1 through S7. Each category contains a cluster of five vertical bars, each a different color, representing five separate data series. The chart uses a clear grid for reference.
### Components/Axes
* **Y-Axis (Vertical):** Labeled "Number of Files". The scale is linear, ranging from 0 to 7, with major gridlines at every integer unit (0, 1, 2, 3, 4, 5, 6, 7).
* **X-Axis (Horizontal):** Labeled "Categories". It lists seven categorical labels: S1, S2, S3, S4, S5, S6, S7.
* **Data Series (Colors):** Five distinct colors are used for the bars within each category cluster. From left to right within a cluster, the colors are: Blue, Orange, Green, Red, Purple. **Note:** There is no visible legend in the image to assign specific meaning or labels to these colors. They represent five unnamed data series.
### Detailed Analysis
The following table reconstructs the data, showing the approximate "Number of Files" for each color series within each category. Values are determined by aligning the top of each bar with the y-axis gridlines.
| Category | Blue Bar | Orange Bar | Green Bar | Red Bar | Purple Bar |
| :--- | :---: | :---: | :---: | :---: | :---: |
| **S1** | 4 | 5 | 2 | 4 | 3 |
| **S2** | 1 | 1 | 1 | 1 | 1 |
| **S3** | 2 | 4 | 4 | 5 | 3 |
| **S4** | 1 | 1 | 1 | 1 | 1 |
| **S5** | 2 | 2 | 1 | 2 | 2 |
| **S6** | 0 | 0 | 4 | 7 | 2 |
| **S7** | 0 | 0 | 4 | 0 | 2 |
**Trend Verification by Category:**
* **S1:** Shows moderate to high counts. The Orange bar is the tallest (5), followed by Blue and Red (4), Purple (3), and Green (2).
* **S2:** All five bars are of equal, low height (1). This indicates a uniform distribution across all series for this category.
* **S3:** Shows a varied distribution. The Red bar is tallest (5), followed by Orange and Green (4), Purple (3), and Blue (2).
* **S4:** Identical to S2; all bars are at the minimum value of 1.
* **S5:** Shows low, mostly uniform counts. Blue, Orange, Red, and Purple are all at 2, while Green is slightly lower at 1.
* **S6:** Shows the most extreme variation. The Red bar is the tallest in the entire chart (7). Green is at 4, Purple at 2, and Blue and Orange are absent (value 0).
* **S7:** Shows only two active series. Green is at 4 and Purple is at 2. Blue, Orange, and Red are absent (value 0).
### Key Observations
1. **Highest Value:** The single highest data point is the Red bar in category **S6**, reaching 7 files.
2. **Lowest Value:** The lowest non-zero value is 1 file, seen in multiple categories (S2, S4, S5-Green). The value 0 (no bar) appears for Blue/Orange in S6 and Blue/Orange/Red in S7.
3. **Uniform Categories:** Categories **S2** and **S4** are perfectly uniform, with all five series having exactly 1 file.
4. **Series Absence:** The Blue and Orange series are completely absent (value 0) in the last two categories (S6, S7). The Red series is absent in S7.
5. **Dominant Series in Categories:** The "winning" (tallest) bar color changes by category: Orange (S1), Red (S3), Red (S6), Green (S7). In S2, S4, and S5, there is a tie or near-tie.
### Interpretation
This chart compares the file count distribution of five unnamed entities (represented by colors) across seven different categories or scenarios (S1-S7).
* **What the data suggests:** The categories S2 and S4 represent scenarios where all measured entities perform identically at a minimal level (1 file). In contrast, categories like S1, S3, and especially S6 show significant differentiation between the entities. S6 is an outlier scenario where one entity (Red) dramatically outperforms all others, while two entities (Blue, Orange) have no presence at all.
* **Relationships:** The chart allows for two primary comparisons: 1) **Within a category:** How the five entities compare against each other in a specific context. 2) **Across categories:** How the performance of a single entity (e.g., the Red series) varies from one context to another. For instance, the Red series is consistently present and often high-performing (4, 1, 5, 1, 2, 7, 0), while the Blue series shows a declining trend, disappearing entirely in the later categories.
* **Notable Anomalies:** The complete absence of certain series in S6 and S7 is a critical finding, suggesting those categories may represent conditions where those specific entities are not applicable or cannot produce files. The extreme spike of the Red series in S6 (7 files) warrants investigation into what makes that category uniquely favorable for that entity.