## Line Graph: Training Time vs. Number of Spins
### Overview
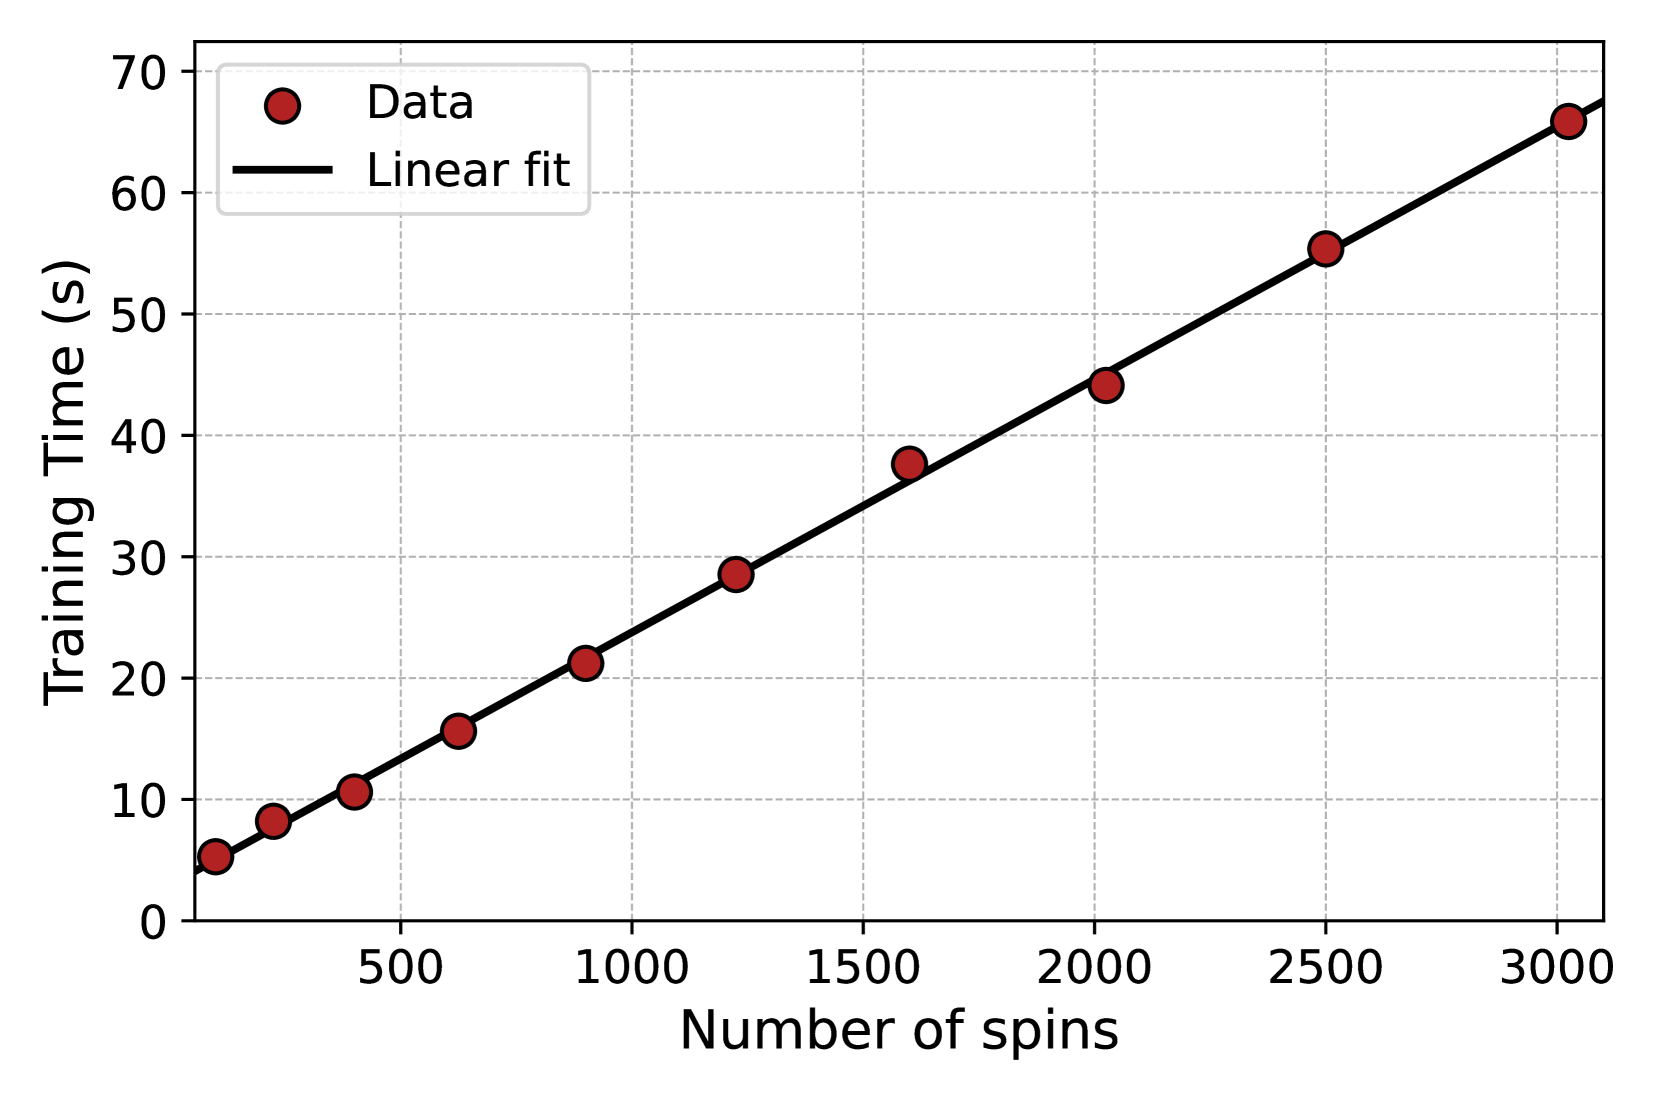
The image depicts a line graph illustrating the relationship between the number of spins and training time (in seconds). A linear fit line is overlaid on the data points, which are represented as red dots. The graph suggests a direct proportional relationship between the two variables.
### Components/Axes
- **X-axis (Horizontal)**: Labeled "Number of spins," with values ranging from 0 to 3000 in increments of 500.
- **Y-axis (Vertical)**: Labeled "Training Time (s)," with values ranging from 0 to 70 in increments of 10.
- **Legend**: Located in the top-left corner, with:
- Red dots labeled "Data"
- Black line labeled "Linear fit"
### Detailed Analysis
- **Data Points**: Red dots are plotted at the following approximate coordinates:
- (250, 5)
- (500, 8)
- (750, 12)
- (1000, 18)
- (1250, 23)
- (1500, 30)
- (1750, 35)
- (2000, 40)
- (2250, 45)
- (2500, 50)
- (2750, 55)
- (3000, 65)
- **Linear Fit**: A black line passes through all data points, indicating a perfect linear relationship. The slope of the line is approximately **0.0218 seconds per spin** (calculated from the rise over run between the first and last data points: (65 - 5) / (3000 - 250) ≈ 0.0218).
### Key Observations
1. **Linear Trend**: The data points align precisely with the linear fit line, confirming a strong linear correlation.
2. **Proportionality**: Training time increases by approximately **0.0218 seconds per spin**.
3. **No Outliers**: All data points lie exactly on the linear fit line, suggesting no anomalies or measurement errors.
### Interpretation
The graph demonstrates that training time scales linearly with the number of spins, implying a direct computational cost per spin. This suggests the model's training efficiency is consistent across different spin counts, with no diminishing returns or unexpected delays. The absence of outliers indicates reliable data collection or a well-optimized algorithm. The linear relationship could be critical for predicting training times in resource planning or algorithm optimization.