# Technical Document: Analysis of ASR for Different Target Models
## Chart Description
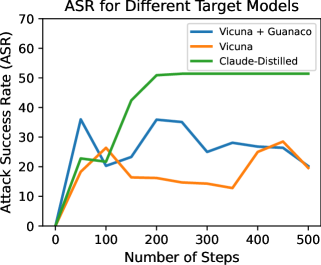
The image is a **line chart** titled **"ASR for Different Target Models"**. It visualizes the **Attack Success Rate (ASR)** across varying numbers of steps for three target models. The chart includes three data series, each represented by a distinct color and labeled in the legend.
---
### **Key Components**
1. **Title**:
- "ASR for Different Target Models"
2. **Axes**:
- **X-axis**: "Number of Steps" (ranging from 0 to 500 in increments of 100).
- **Y-axis**: "Attack Success Rate (ASR)" (ranging from 0 to 70 in increments of 10).
3. **Legend**:
- **Placement**: Top-right corner of the chart.
- **Labels and Colors**:
- **Blue**: Vicuna + Guanaco
- **Orange**: Vicuna
- **Green**: Claude-Distilled
4. **Data Series**:
- Three lines correspond to the models in the legend.
---
### **Data Trends and Points**
#### **1. Vicuna + Guanaco (Blue Line)**
- **Trend**:
- Starts at 0 ASR at 0 steps.
- Peaks at **~35 ASR** around 50 steps.
- Fluctuates between **~20–35 ASR** until 500 steps, ending at **~20 ASR**.
- **Key Data Points**:
- [0, 0], [50, 35], [100, 20], [200, 35], [300, 25], [400, 27], [500, 20].
#### **2. Vicuna (Orange Line)**
- **Trend**:
- Starts at 0 ASR at 0 steps.
- Peaks at **~25 ASR** around 100 steps.
- Dips to **~15 ASR** by 200 steps.
- Rises again to **~25 ASR** around 450 steps, ending at **~20 ASR**.
- **Key Data Points**:
- [0, 0], [100, 25], [200, 15], [300, 14], [400, 25], [500, 20].
#### **3. Claude-Distilled (Green Line)**
- **Trend**:
- Starts at 0 ASR at 0 steps.
- Rises sharply to **~50 ASR** by 200 steps.
- Plateaus at **~50 ASR** until 500 steps.
- **Key Data Points**:
- [0, 0], [100, 22], [200, 50], [300, 50], [400, 50], [500, 50].
---
### **Legend Validation**
- **Color Consistency**:
- Blue line matches "Vicuna + Guanaco" in the legend.
- Orange line matches "Vicuna."
- Green line matches "Claude-Distilled."
---
### **Spatial Grounding**
- **Legend Position**: Top-right corner of the chart.
- **Axis Labels**: Centered below (X-axis) and above (Y-axis) the plot area.
---
### **Conclusion**
The chart demonstrates that **Claude-Distilled** consistently achieves the highest ASR, stabilizing near 50 after 200 steps. **Vicuna + Guanaco** shows moderate performance with fluctuations, while **Vicuna** exhibits the most variability, peaking early and declining thereafter.
**Note**: No additional languages or data tables are present in the image. All textual information has been extracted and transcribed.