## Diagram: State Transformation
### Overview
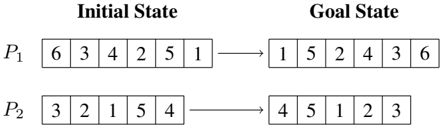
The image illustrates a state transformation process, showing the "Initial State" transitioning to the "Goal State" for two entities, labeled P1 and P2. Each state is represented by a sequence of numbers within boxes.
### Components/Axes
* **Titles:** "Initial State" (top-left), "Goal State" (top-right)
* **Entities:** P1, P2
* **States:** Each state is represented by a sequence of six numbers in boxes.
* **Flow:** Arrows indicate the transformation from the Initial State to the Goal State for each entity.
### Detailed Analysis
* **P1:**
* Initial State: 6, 3, 4, 2, 5, 1
* Goal State: 1, 5, 2, 4, 3, 6
* **P2:**
* Initial State: 3, 2, 1, 5, 4
* Goal State: 4, 5, 1, 2, 3
### Key Observations
* The numbers in each state appear to be a permutation of the integers from 1 to 6 for P1, and 1 to 5 for P2.
* The transformation represents a reordering of the numbers within the sequence.
### Interpretation
The diagram likely represents a step in an algorithm or process where the order of elements in a sequence is changed. This could be related to sorting, optimization, or other computational tasks. The specific transformation applied is not defined, but the diagram clearly shows the initial and final states for two different entities.