\n
## Diagram: State Transition
### Overview
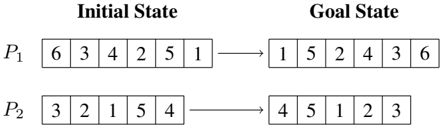
The image depicts a state transition diagram showing two permutations, labeled P1 and P2, transitioning from an "Initial State" to a "Goal State". Each permutation is represented as a sequence of numbers within a rectangular box. An arrow indicates the transformation from the initial to the goal state.
### Components/Axes
The diagram consists of two rows, each representing a permutation.
- **Row 1:** Labeled "P1"
- **Row 2:** Labeled "P2"
- **Column Headers:** "Initial State" and "Goal State"
Each permutation is represented by a sequence of numbers within a rectangular box.
### Detailed Analysis or Content Details
**P1:**
- **Initial State:** The sequence is 6, 3, 4, 2, 5, 1.
- **Goal State:** The sequence is 1, 5, 2, 4, 3, 6.
**P2:**
- **Initial State:** The sequence is 3, 2, 1, 5, 4.
- **Goal State:** The sequence is 4, 5, 1, 2, 3.
### Key Observations
The diagram illustrates two distinct permutations and their corresponding transformations. The transformation from the initial state to the goal state is not explicitly defined; it is simply shown as a transition. The permutations are of different lengths (P1 has 6 elements, P2 has 5 elements).
### Interpretation
The diagram likely represents a problem in permutation or sorting. The "Initial State" represents the starting arrangement of elements, and the "Goal State" represents the desired arrangement. The diagram does not provide the algorithm or method used to achieve the transformation, only the before and after states. The differing lengths of the permutations suggest that the problem may involve permutations of varying sizes, or that the two permutations are independent examples of the same problem. The diagram could be used to illustrate the concept of a state space in search algorithms, where the initial and goal states are defined, and the algorithm must find a path to transform one into the other.