## Box Plot: Token Length Comparison
### Overview
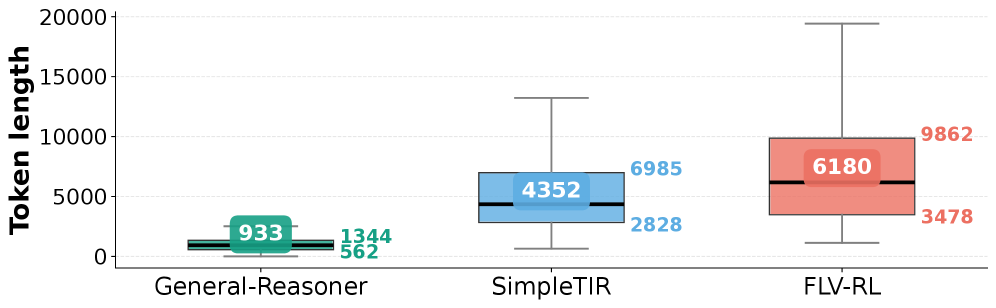
The image is a box plot comparing the token lengths of three different models: General-Reasoner, SimpleTIR, and FLV-RL. The y-axis represents "Token length", and the x-axis represents the model names. The plot displays the distribution of token lengths for each model, showing the median, quartiles, and outliers.
### Components/Axes
* **X-axis:** Model names: General-Reasoner, SimpleTIR, FLV-RL
* **Y-axis:** Token length, with a scale from 0 to 20000. Gridlines are present at intervals of approximately 5000.
* **Box Plots:** Each box plot represents the distribution of token lengths for a specific model.
* The box represents the interquartile range (IQR), containing the middle 50% of the data.
* The line inside the box represents the median.
* The whiskers extend to the furthest data point within 1.5 times the IQR from the box.
* Outliers are represented as individual points beyond the whiskers.
* **Data Labels:** Numerical values are displayed near each box plot, indicating specific statistical values.
### Detailed Analysis
* **General-Reasoner (Green Box):**
* Median: Approximately 933
* Q1 (25th percentile): Approximately 562
* Q3 (75th percentile): Approximately 1344
* The box is relatively small, indicating a narrow range of token lengths.
* **SimpleTIR (Blue Box):**
* Median: Approximately 4352
* Q1 (25th percentile): Approximately 2828
* Q3 (75th percentile): Approximately 6985
* The box is larger than that of General-Reasoner, indicating a wider range of token lengths.
* **FLV-RL (Red Box):**
* Median: Approximately 6180
* Q1 (25th percentile): Approximately 3478
* Q3 (75th percentile): Approximately 9862
* The box is the largest, indicating the widest range of token lengths.
### Key Observations
* The median token length increases from General-Reasoner to SimpleTIR to FLV-RL.
* The interquartile range (IQR) also increases from General-Reasoner to SimpleTIR to FLV-RL, indicating greater variability in token lengths for the latter models.
* FLV-RL has a significantly larger range of token lengths compared to the other two models.
### Interpretation
The box plot illustrates the distribution of token lengths generated by three different models. General-Reasoner produces the shortest and most consistent token lengths, while FLV-RL generates the longest and most variable token lengths. SimpleTIR falls in between these two. This suggests that FLV-RL might be generating more complex or verbose outputs compared to the other models. The wider range of token lengths for FLV-RL could also indicate that it is more sensitive to variations in input or task complexity.