## Diagram: Sequential and Hierarchical Process Flow
### Overview
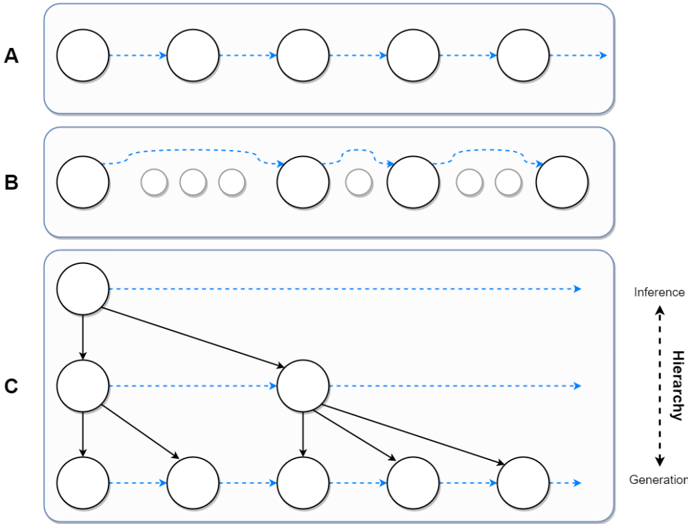
The image presents three interconnected diagrams (A, B, C) illustrating process flows with circular nodes and directional arrows. A vertical axis on the right side labels "Inference" (↑), "Hierarchy" (↓), and "Generation" (→), suggesting layered or multidimensional relationships between the diagrams.
---
### Components/Axes
1. **Diagrams A-C**:
- **Nodes**: White circles representing process steps/states.
- **Arrows**:
- **Solid lines**: Mandatory sequential steps (Diagram A).
- **Dashed lines**: Optional or alternative pathways (Diagram B).
- **Branching lines**: Decision points or parallel processes (Diagram C).
- **Labels**:
- **Right-side axis**:
- "Inference" (↑): Vertical upward arrow.
- "Hierarchy" (↓): Vertical downward arrow.
- "Generation" (→): Horizontal rightward arrow.
2. **Spatial Layout**:
- Diagrams A-C are stacked vertically, with Diagram C at the bottom.
- Right-side labels are positioned outside the diagrams, aligned vertically.
---
### Detailed Analysis
#### Diagram A
- **Structure**: Linear chain of 6 nodes connected by solid arrows (→).
- **Flow**: Strict sequential progression from left to right.
- **Key Feature**: No branching or optional steps.
#### Diagram B
- **Structure**: 8 nodes with 3 missing (represented by grayed-out circles).
- **Flow**:
- Solid arrows between nodes 1→2, 4→5, 7→8.
- Dashed arrows between nodes 2→4 and 5→7, suggesting skipped steps or alternative routes.
- **Key Feature**: Partial connectivity with optional transitions.
#### Diagram C
- **Structure**: 8 nodes with complex branching:
- Node 1 → Nodes 2 and 3 (parallel paths).
- Node 3 → Nodes 4 and 5 (decision point).
- Node 5 → Nodes 6 and 7 (parallel outcomes).
- Node 7 → Node 8 (final step).
- **Flow**: Hierarchical and non-linear, with multiple pathways converging at Node 8.
---
### Key Observations
1. **Arrow Style Significance**:
- Solid arrows (A) = Fixed dependencies.
- Dashed arrows (B) = Flexibility or uncertainty.
- Branching arrows (C) = Decision-making nodes.
2. **Right-Side Labels**:
- "Inference" (↑) and "Hierarchy" (↓) imply vertical relationships (e.g., top-down vs. bottom-up processes).
- "Generation" (→) suggests temporal or sequential progression.
3. **Node Density**:
- Diagram C has the most nodes (8), indicating complexity.
- Diagram B has gaps (3 missing nodes), possibly representing incomplete data or optional stages.
---
### Interpretation
1. **Process Evolution**:
- Diagram A represents a rigid, linear workflow.
- Diagram B introduces variability, with optional steps (dashed arrows) and missing nodes (grayed-out circles), suggesting adaptability or uncertainty.
- Diagram C embodies a decision tree or parallel processing model, where multiple pathways converge at a final node (Node 8).
2. **Hierarchical Relationships**:
- The vertical axis ("Inference" ↔ "Hierarchy") may represent layers of abstraction or authority (e.g., high-level decisions vs. granular execution).
- "Generation" (→) could denote iterative cycles or forward momentum in a system.
3. **Anomalies**:
- Diagram B’s missing nodes (3) might indicate incomplete data or stages that are context-dependent.
- Diagram C’s branching could reflect real-world complexity where outcomes are not deterministic.
---
### Conclusion
The diagrams collectively illustrate a spectrum of process complexity, from linear execution (A) to adaptive workflows (B) and decision-driven systems (C). The right-side labels ("Inference," "Hierarchy," "Generation") suggest a framework for analyzing processes across vertical (layered) and horizontal (temporal) dimensions. This structure could model organizational workflows, algorithmic pipelines, or systems with interdependent stages.