## Diagram: Hierarchical Inference and Generation
### Overview
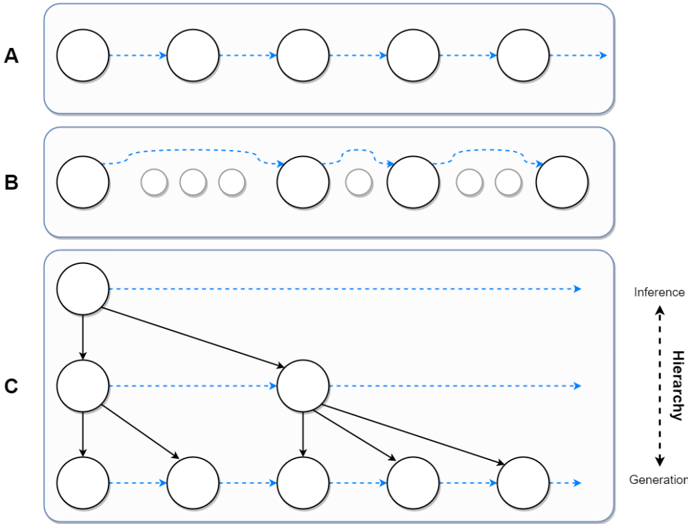
The image presents a diagram illustrating three different models (A, B, and C) representing hierarchical inference and generation processes. Each model is contained within a rounded rectangle. Model A shows a simple linear sequence. Model B shows a sequence with varying node sizes and a loop-back. Model C shows a hierarchical tree structure. An arrow on the right indicates the direction of "Inference" (upwards) and "Generation" (downwards) along the hierarchy.
### Components/Axes
* **Models:** A, B, C (labeled on the left side of each model's rounded rectangle)
* **Nodes:** Represented by circles. In model B, some nodes are smaller and grayed out.
* **Connections:** Represented by arrows. Solid black arrows indicate direct hierarchical relationships. Dashed blue arrows indicate inference/generation flow.
* **Hierarchy Axis:** A vertical axis on the right side of the diagram, labeled "Inference" at the top, "Hierarchy" in the middle, and "Generation" at the bottom.
### Detailed Analysis
**Model A:**
* Consists of four white circles of equal size, arranged linearly from left to right.
* Each circle is connected to the next by a dashed blue arrow, indicating a sequential flow.
* The overall trend is a simple, linear progression.
**Model B:**
* Begins with a white circle on the left.
* Followed by three smaller, grayed-out circles.
* Then, a white circle, followed by two more white circles of increasing size.
* The connections are dashed blue arrows. The arrow from the first white circle loops back to the first grayed-out circle.
* The trend is a sequence with varying node sizes and a feedback loop.
**Model C:**
* Represents a hierarchical tree structure.
* Starts with a single white circle at the top.
* This circle connects to two white circles in the next level via solid black lines.
* The left circle in the second level connects to two white circles in the third level.
* The right circle in the second level connects to two white circles in the third level.
* Dashed blue arrows indicate the inference/generation flow, moving horizontally from left to right at each level.
* The trend is a branching hierarchy, with information flowing both vertically (hierarchy) and horizontally (inference/generation).
**Hierarchy Axis:**
* Located on the right side of the diagram.
* Indicates the direction of inference (upwards) and generation (downwards) within the hierarchical structure.
### Key Observations
* Model A represents a simple sequential process.
* Model B introduces variability in node size and a feedback loop.
* Model C demonstrates a hierarchical structure with branching and multiple levels.
* The dashed blue arrows consistently indicate the direction of inference/generation.
* The solid black arrows in Model C represent direct hierarchical relationships.
### Interpretation
The diagram illustrates different approaches to modeling hierarchical inference and generation. Model A represents a basic linear model, while Model B introduces complexity through varying node sizes and feedback. Model C provides a more sophisticated hierarchical representation, allowing for branching and multi-level relationships. The hierarchy axis clarifies the direction of inference (from lower levels to higher levels) and generation (from higher levels to lower levels). The diagram suggests that hierarchical inference and generation can be modeled using various structures, each with its own strengths and weaknesses depending on the specific application.