\n
## Diagram: Generative Model Architectures
### Overview
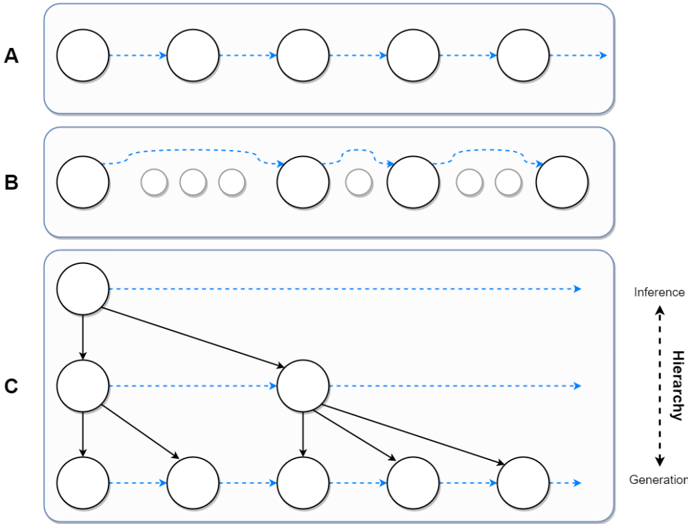
The image presents three different architectural diagrams (labeled A, B, and C) representing generative models. Each diagram illustrates a sequence of circular nodes connected by arrows, depicting the flow of information or processing steps. A vertical axis labeled "Inference/Hierarchy/Generation" is present on the right side of diagram C, indicating the direction of these processes.
### Components/Axes
* **Diagram A:** A linear sequence of six circular nodes connected by dotted arrows pointing to the right.
* **Diagram B:** A sequence of six circular nodes, but with a dotted line connecting the first and last nodes, creating a loop. The arrows between nodes point to the right.
* **Diagram C:** A hierarchical, branching structure. A single node at the top splits into two, then each of those splits into two, and so on, resulting in a tree-like structure with six nodes at the bottom level. Arrows indicate the direction of flow.
* **Axis:** A vertical axis labeled "Inference" at the top, "Hierarchy" in the middle, and "Generation" at the bottom. This axis is positioned to the right of diagram C and indicates the direction of the processes.
### Detailed Analysis or Content Details
* **Diagram A:** Represents a sequential generative process. The dotted arrows suggest a step-by-step generation of data. There are six nodes in a linear arrangement.
* **Diagram B:** Represents a recurrent or looped generative process. The dotted line connecting the first and last nodes indicates feedback or a cyclical process. There are six nodes in a linear arrangement with a loop.
* **Diagram C:** Represents a hierarchical generative process. The branching structure suggests that the model generates data at multiple levels of abstraction. The top node can be considered the root, and the bottom nodes represent the final generated output. The branching indicates increasing complexity or detail.
* The first split occurs after the first node.
* The second split occurs after the second and third nodes.
* The third split occurs after the fourth, fifth, sixth and seventh nodes.
* The final nodes are arranged horizontally.
### Key Observations
* Diagram A is the simplest, representing a straightforward sequential process.
* Diagram B introduces a feedback loop, suggesting a more complex, iterative process.
* Diagram C is the most complex, representing a hierarchical process with multiple levels of abstraction.
* The "Inference/Hierarchy/Generation" axis in Diagram C suggests that the model first infers a high-level representation, then builds a hierarchy of representations, and finally generates the output.
### Interpretation
The diagrams likely illustrate different approaches to generative modeling. Diagram A could represent a simple autoregressive model, where each element is generated based on the previous ones. Diagram B could represent a recurrent neural network (RNN) or a variational autoencoder (VAE) with a recurrent component, where the output is fed back into the input. Diagram C could represent a hierarchical generative model, such as a hierarchical VAE or a generative adversarial network (GAN) with a hierarchical structure.
The "Inference/Hierarchy/Generation" axis in Diagram C highlights the key stages of a hierarchical generative model. Inference refers to the process of learning a latent representation of the data. Hierarchy refers to the organization of the latent space into multiple levels of abstraction. Generation refers to the process of creating new data from the latent representation.
The diagrams demonstrate a progression in complexity, from a simple sequential process to a more complex hierarchical process. This progression reflects the increasing sophistication of generative modeling techniques. The choice of architecture depends on the specific application and the desired level of control over the generated data. The diagrams are conceptual and do not provide specific numerical data or parameters. They are intended to illustrate the general principles of different generative modeling approaches.