# Technical Document Extraction: Performance Comparison Chart
## 1. Image Overview
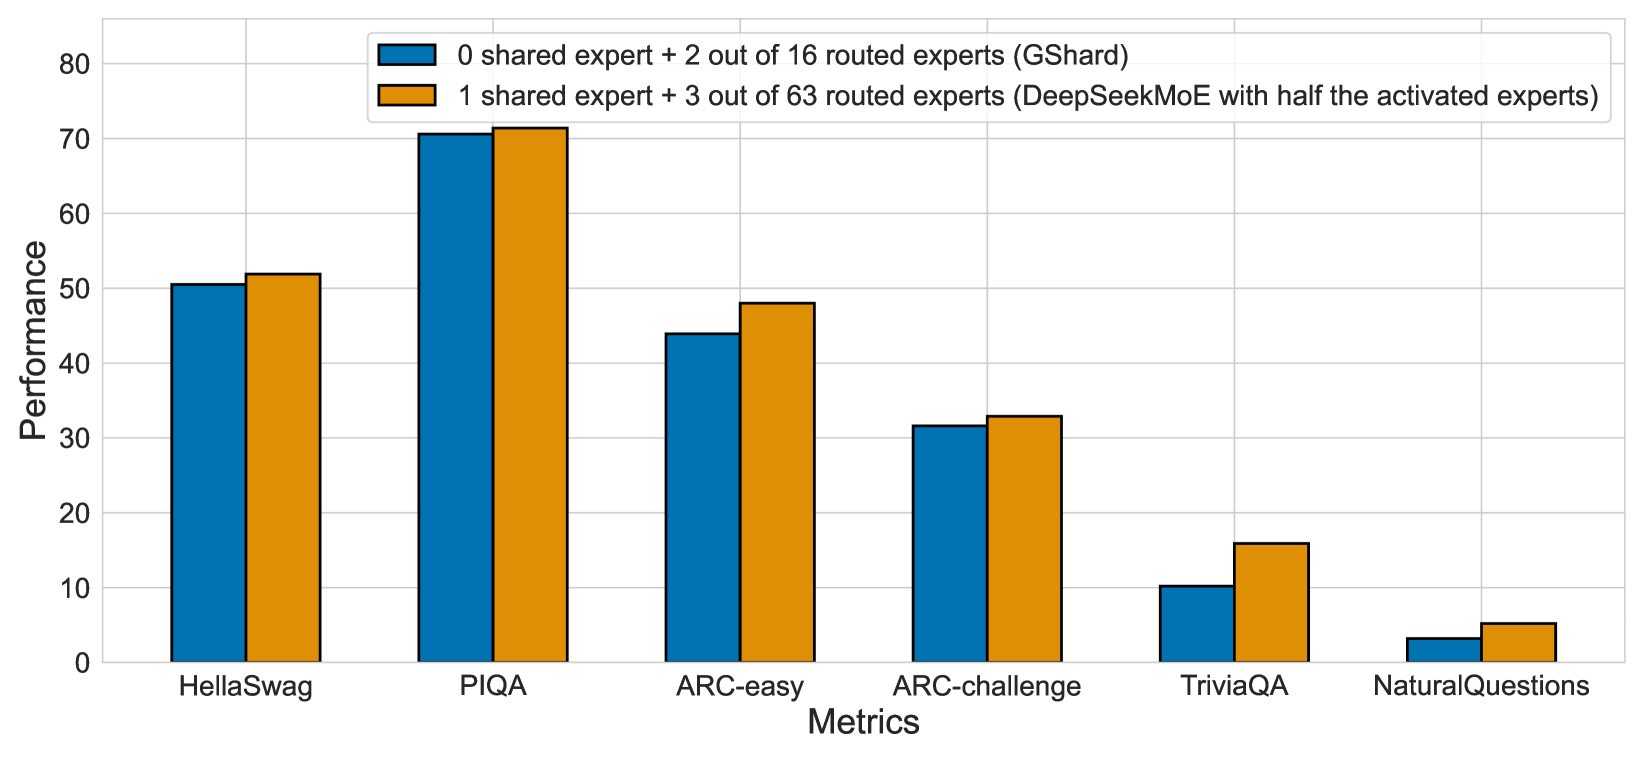
This image is a grouped bar chart comparing the performance of two different Mixture-of-Experts (MoE) architectural configurations across six distinct natural language processing (NLP) benchmarks.
## 2. Component Isolation
### A. Header / Legend
* **Location:** Top-center of the chart area.
* **Series 1 (Blue):** `0 shared expert + 2 out of 16 routed experts (GShard)`
* **Series 2 (Orange):** `1 shared expert + 3 out of 63 routed experts (DeepSeekMoE with half the activated experts)`
### B. Main Chart Area (Axes)
* **Y-Axis (Vertical):**
* **Label:** `Performance`
* **Scale:** Linear, ranging from 0 to 80.
* **Markers:** 0, 10, 20, 30, 40, 50, 60, 70, 80.
* **X-Axis (Horizontal):**
* **Label:** `Metrics`
* **Categories:** HellaSwag, PIQA, ARC-easy, ARC-challenge, TriviaQA, NaturalQuestions.
## 3. Data Extraction and Trend Analysis
### Trend Verification
Across all six metrics, the **Orange series** (DeepSeekMoE configuration) consistently outperforms the **Blue series** (GShard configuration). The performance gap is most pronounced in the `TriviaQA` and `NaturalQuestions` benchmarks relative to their total scale, while the gap is smallest in the `ARC-challenge` benchmark.
### Data Table (Estimated Values)
The following table reconstructs the data points based on the visual alignment with the Y-axis grid lines.
| Metric | GShard (Blue) | DeepSeekMoE (Orange) |
| :--- | :---: | :---: |
| HellaSwag | ~50.5 | ~52.0 |
| PIQA | ~70.5 | ~71.5 |
| ARC-easy | ~44.0 | ~48.0 |
| ARC-challenge | ~31.5 | ~33.0 |
| TriviaQA | ~10.2 | ~16.0 |
| NaturalQuestions | ~3.2 | ~5.2 |
## 4. Detailed Component Analysis
* **HellaSwag:** Both models perform strongly here, exceeding the 50-point mark. The orange bar is slightly higher.
* **PIQA:** This is the highest-performing category for both models, with both exceeding 70. The orange bar shows a marginal lead.
* **ARC-easy:** A noticeable performance gap exists here; the blue bar sits below the 45 line, while the orange bar reaches nearly 50.
* **ARC-challenge:** Performance drops significantly compared to ARC-easy for both models, settling in the low 30s.
* **TriviaQA:** A significant relative difference is observed. The orange bar is approximately 50% taller than the blue bar (approx. 16 vs 10).
* **NaturalQuestions:** The lowest performance category for both. The orange bar (approx. 5) is nearly double the height of the blue bar (approx. 3).
## 5. Summary of Findings
The chart demonstrates that the **DeepSeekMoE** architecture (utilizing 1 shared expert and 3 out of 63 routed experts) provides superior performance across all tested benchmarks compared to the **GShard** architecture (0 shared experts and 2 out of 16 routed experts), even when the DeepSeekMoE configuration is restricted to "half the activated experts." This suggests that the inclusion of shared experts and a larger pool of routed experts (even with sparse activation) contributes to higher model accuracy.