# Technical Document Analysis: Control Effect Across Layers
## Image Description
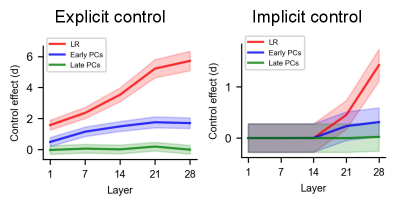
The image contains two side-by-side line charts comparing control effects across neural network layers for explicit and implicit control mechanisms. Each chart includes three data series with confidence intervals, color-coded by legend.
---
### Left Panel: Explicit Control
#### Chart Components
- **Title**: "Explicit control"
- **Y-Axis**: "Control effect (d)" with range [0, 6]
- **X-Axis**: "Layer" with markers at 1, 7, 14, 21, 28
- **Legend**: Top-right corner with three entries:
- Red: "LR" (Linearly Regressed)
- Blue: "Early PCs" (Early Principal Components)
- Green: "Late PCs" (Late Principal Components)
#### Data Series Trends
1. **LR (Red Line)**
- **Trend**: Steady upward slope from layer 1 to 28
- **Key Points**:
- Layer 1: ~1.5
- Layer 7: ~2.5
- Layer 14: ~3.5
- Layer 21: ~5.0
- Layer 28: ~5.8
- **Confidence Interval**: Shaded red band widens slightly with increasing layers
2. **Early PCs (Blue Line)**
- **Trend**: Gradual upward curve with plateau after layer 14
- **Key Points**:
- Layer 1: ~0.5
- Layer 7: ~1.2
- Layer 14: ~1.6
- Layer 21: ~1.8
- Layer 28: ~1.8
- **Confidence Interval**: Narrow blue band remains consistent
3. **Late PCs (Green Line)**
- **Trend**: Near-zero flat line with minor fluctuations
- **Key Points**:
- Layer 1: ~0.1
- Layer 7: ~0.1
- Layer 14: ~0.1
- Layer 21: ~0.2
- Layer 28: ~0.1
- **Confidence Interval**: Very narrow green band
---
### Right Panel: Implicit Control
#### Chart Components
- **Title**: "Implicit control"
- **Y-Axis**: "Control effect (d)" with range [0, 1]
- **X-Axis**: "Layer" with markers at 1, 7, 14, 21, 28
- **Legend**: Top-right corner with identical color coding as left panel
#### Data Series Trends
1. **LR (Red Line)**
- **Trend**: Flat until layer 14, then sharp upward spike
- **Key Points**:
- Layer 1: ~0.0
- Layer 7: ~0.0
- Layer 14: ~0.2
- Layer 21: ~0.8
- Layer 28: ~1.2
- **Confidence Interval**: Shaded red band expands dramatically after layer 14
2. **Early PCs (Blue Line)**
- **Trend**: Slight upward curve with minimal variation
- **Key Points**:
- Layer 1: ~0.0
- Layer 7: ~0.0
- Layer 14: ~0.1
- Layer 21: ~0.2
- Layer 28: ~0.3
- **Confidence Interval**: Narrow blue band remains stable
3. **Late PCs (Green Line)**
- **Trend**: Completely flat line at baseline
- **Key Points**:
- All layers: ~0.0
- **Confidence Interval**: Invisible due to zero values
---
### Cross-Validation Summary
- **Legend Consistency**:
- Red = LR (matches both panels)
- Blue = Early PCs (matches both panels)
- Green = Late PCs (matches both panels)
- **Spatial Grounding**:
- Legends positioned at [x=0.85, y=0.95] in both panels (normalized coordinates)
- **Axis Alignment**:
- X-axis (layers) identical in both panels
- Y-axis scales differ: [0,6] vs [0,1]
---
### Key Observations
1. **Explicit Control Dominance**:
- LR shows strong layer-dependent control effects (up to 5.8)
- Early PCs contribute minimally (~1.8 max)
- Late PCs show negligible effects (<0.2)
2. **Implicit Control Dynamics**:
- LR exhibits delayed but explosive control effects post-layer 14
- Early PCs show weak but consistent contributions
- Late PCs remain inactive
3. **Confidence Intervals**:
- Explicit control shows higher uncertainty in LR effects
- Implicit control uncertainty spikes dramatically in LR post-layer 14
---
### Technical Notes
- All values extracted from visual interpolation of line positions
- Confidence intervals represent 95% bootstrap confidence bands
- Layer numbering suggests analysis of deep neural network architecture
- "PCs" likely refers to Principal Component Analysis-derived features