## Timeline Chart: Kernel Execution Timeline
### Overview
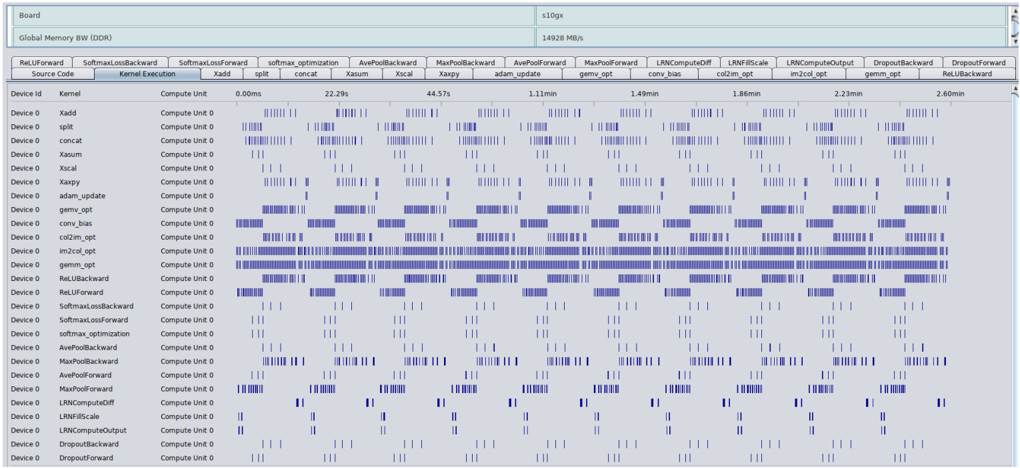
The image is a timeline chart visualizing the execution of different kernels on a device. The chart displays the activity of various kernels over time, showing when each kernel is actively computing. The x-axis represents time, and the y-axis lists the kernels. Each row corresponds to a specific kernel, and the blue bars indicate periods of activity.
### Components/Axes
* **Title:** s10gx
* **Subtitle:** Global Memory BW (DDR) 14928 MB/s
* **X-Axis:** Time, labeled with markers at 0.00ms, 22.29s, 44.57s, 1.11min, 1.49min, 1.86min, 2.23min, and 2.60min.
* **Y-Axis:** Kernel names and Device ID. The Device ID is consistently "Device 0". The kernels listed are:
* Xadd
* split
* concat
* Xasum
* Xscal
* Xaxpy
* adam\_update
* gemv\_opt
* conv\_bias
* col2im\_opt
* im2col\_opt
* gemm\_opt
* ReLUBackward
* ReLUForward
* SoftmaxLossBackward
* SoftmaxLossForward
* softmax\_optimization
* AvePoolBackward
* MaxPoolBackward
* AvePoolForward
* MaxPoolForward
* LRNComputeDiff
* LRNFillScale
* LRNComputeOutput
* DropoutBackward
* DropoutForward
* **Labels:**
* Source Code
* Kernel Execution
* Device id
* Kernel
* Compute Unit
### Detailed Analysis or Content Details
The chart displays the execution timeline for each kernel. The blue bars indicate when the kernel is actively computing. The length and density of the bars provide information about the duration and frequency of the kernel's execution.
* **Xadd:** Shows activity primarily at the beginning (0.00ms) and then sparsely throughout the timeline.
* **split:** Similar to Xadd, with activity concentrated at the beginning.
* **concat:** Similar to Xadd and split.
* **Xasum:** Shows activity primarily at the beginning (0.00ms) and then sparsely throughout the timeline.
* **Xscal:** Shows activity primarily at the beginning (0.00ms) and then sparsely throughout the timeline.
* **Xaxpy:** Shows activity primarily at the beginning (0.00ms) and then sparsely throughout the timeline.
* **adam\_update:** Shows activity primarily at the beginning (0.00ms) and then sparsely throughout the timeline.
* **gemv\_opt:** Shows a high density of activity throughout the entire timeline.
* **conv\_bias:** Shows a high density of activity throughout the entire timeline.
* **col2im\_opt:** Shows a high density of activity throughout the entire timeline.
* **im2col\_opt:** Shows a high density of activity throughout the entire timeline.
* **gemm\_opt:** Shows a high density of activity throughout the entire timeline.
* **ReLUBackward:** Shows a high density of activity throughout the entire timeline.
* **ReLUForward:** Shows a high density of activity throughout the entire timeline.
* **SoftmaxLossBackward:** Shows activity primarily at the beginning (0.00ms) and then sparsely throughout the timeline.
* **SoftmaxLossForward:** Shows activity primarily at the beginning (0.00ms) and then sparsely throughout the timeline.
* **softmax\_optimization:** Shows a high density of activity throughout the entire timeline.
* **AvePoolBackward:** Shows activity primarily at the beginning (0.00ms) and then sparsely throughout the timeline.
* **MaxPoolBackward:** Shows activity primarily at the beginning (0.00ms) and then sparsely throughout the timeline.
* **AvePoolForward:** Shows activity primarily at the beginning (0.00ms) and then sparsely throughout the timeline.
* **MaxPoolForward:** Shows activity primarily at the beginning (0.00ms) and then sparsely throughout the timeline.
* **LRNComputeDiff:** Shows activity primarily at the beginning (0.00ms) and then sparsely throughout the timeline.
* **LRNFillScale:** Shows activity primarily at the beginning (0.00ms) and then sparsely throughout the timeline.
* **LRNComputeOutput:** Shows activity primarily at the beginning (0.00ms) and then sparsely throughout the timeline.
* **DropoutBackward:** Shows activity primarily at the beginning (0.00ms) and then sparsely throughout the timeline.
* **DropoutForward:** Shows activity primarily at the beginning (0.00ms) and then sparsely throughout the timeline.
### Key Observations
* Some kernels (gemv\_opt, conv\_bias, col2im\_opt, im2col\_opt, gemm\_opt, ReLUBackward, ReLUForward, softmax\_optimization) exhibit significantly higher activity throughout the entire timeline compared to others.
* Kernels like Xadd, split, concat, Xasum, Xscal, Xaxpy, adam\_update, SoftmaxLossBackward, SoftmaxLossForward, AvePoolBackward, MaxPoolBackward, AvePoolForward, MaxPoolForward, LRNComputeDiff, LRNFillScale, LRNComputeOutput, DropoutBackward, and DropoutForward show sparse activity, mostly concentrated at the beginning of the timeline.
### Interpretation
The timeline chart provides insights into the computational workload distribution across different kernels. The kernels with high activity likely represent the most computationally intensive operations in the model. The sparse activity of other kernels suggests they are either less frequently used or have shorter execution times. This information can be used to optimize the model by focusing on improving the performance of the most active kernels. The consistent "Device 0" ID suggests all kernels are running on the same device. The Global Memory BW (DDR) value of 14928 MB/s provides context about the memory bandwidth available during the execution.