## Timeline Chart of Kernel Execution
### Overview
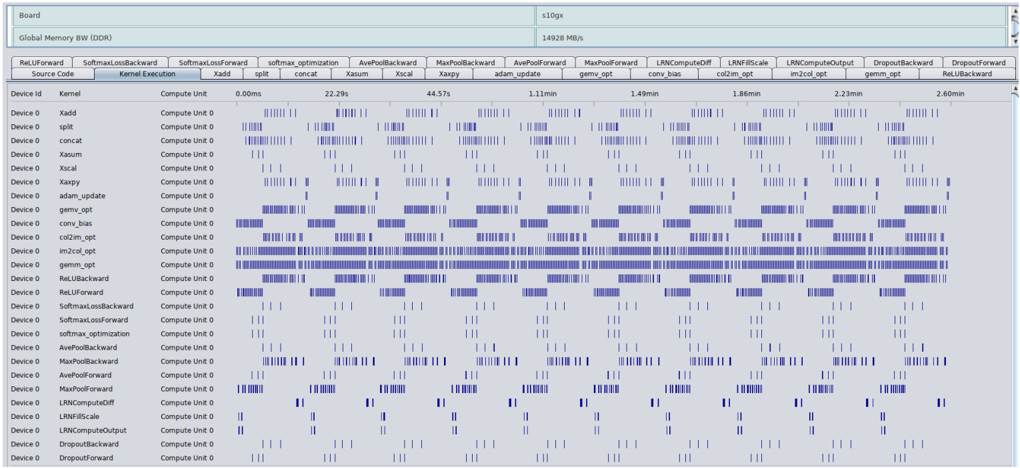
This image is a performance profiling timeline chart, likely from a GPU or accelerator performance analysis tool (e.g., NVIDIA Nsight Systems, AMD ROCm Profiler). It visualizes the execution timeline of various computational kernels on a device over a period of approximately 2.6 minutes. The chart is designed to show when each kernel runs, for how long, and how they overlap or sequence on the available compute units.
### Components/Axes
**Header Information (Top Section):**
* **Board:** `s10gx`
* **Global Memory BW (DDR):** `14928 MB/s`
**Main Chart Area:**
* **Horizontal Axis (X-axis):** Time, measured in milliseconds (ms) and minutes (min). Key markers are: `0.00ms`, `22.29s`, `44.57s`, `1.11min`, `1.49min`, `1.86min`, `2.23min`, `2.60min`.
* **Vertical Axis (Y-axis):** A list of kernel names. Each row represents a distinct kernel.
* **Legend/Kernel List (Top Bar):** A horizontal bar lists the kernel names corresponding to the rows below. From left to right: `RelUForward`, `SoftmaxLossBackward`, `SoftmaxLossForward`, `softmax_optimization`, `AvePoolBackward`, `MaxPoolBackward`, `AvePoolForward`, `MaxPoolForward`, `LRNComputeOff`, `LRNIFMScale`, `LRNComputeOutput`, `DropoutBackward`, `DropoutForward`, `RelUBackward`.
* **Data Representation:** Blue vertical bars or blocks indicate periods when a specific kernel is executing on "Compute Unit 0" of "Device 0". The density and length of these bars represent the frequency and duration of execution calls.
### Detailed Analysis
**Kernel Execution Patterns:**
The chart lists 28 distinct kernel names in the leftmost column. Each kernel's execution is plotted against the timeline. The execution patterns vary significantly:
1. **High-Frequency, Short-Duration Kernels:** Kernels like `Xadd`, `split`, `concat`, `Xsum`, `Xscal`, `Xaxpy`, `adam_update`, `conv_bias`, `col2im_opt`, `gemm_opt`, `im2col_opt`, `RelUBackward`, and `RelUForward` show a very high density of execution calls. They appear as near-continuous bands of blue, especially `gemm_opt` and `im2col_opt`, which are almost solid blue blocks for large portions of the timeline. This indicates they are called very frequently, likely within inner loops of a training iteration.
2. **Periodic/Intermittent Kernels:** Kernels such as `SoftmaxLossBackward`, `SoftmaxLossForward`, `softmax_optimization`, `AvePoolBackward`, `MaxPoolBackward`, `AvePoolForward`, `MaxPoolForward`, `LRNComputeOff`, `LRNIFMScale`, `LRNComputeOutput`, `DropoutBackward`, and `DropoutForward` execute in distinct, periodic bursts. Their blue bars are clustered at regular intervals, suggesting they are invoked once per training batch or epoch.
3. **Sparse Execution:** A few kernels like `Xadd` and `split` at the top show very sparse, isolated execution bars compared to others.
**Temporal Distribution:**
* The timeline spans from `0.00ms` to `2.60min`.
* Execution is not uniform. There are periods of intense, overlapping activity (e.g., between `1.11min` and `1.49min`) and periods where fewer kernels are active.
* The periodic kernels (e.g., `SoftmaxLoss*`, `Pool*`, `LRN*`, `Dropout*`) appear to synchronize their bursts, firing in a coordinated sequence at roughly the same time points across the timeline.
### Key Observations
1. **Dominant Kernels:** The `gemm_opt` (General Matrix Multiply, optimized) and `im2col_opt` (image-to-column, optimized) kernels are the most persistently active, forming the computational backbone of the workload. This is typical for deep learning training, where convolution operations (often implemented via GEMM after im2col) dominate.
2. **Workflow Structure:** The periodic, synchronized bursts of the non-GEMM kernels (loss, pooling, normalization, dropout) suggest a clear training loop structure: forward pass, loss computation, backward pass, and parameter update. The `adam_update` kernel's frequent activity aligns with this.
3. **Compute Unit Utilization:** All activity is plotted for "Compute Unit 0" on "Device 0". The chart does not show activity on other compute units, which could imply single-stream execution or that this view is filtered to one unit.
4. **Memory Bandwidth Context:** The noted Global Memory Bandwidth of `14928 MB/s` (~14.6 GB/s) provides context for the performance ceiling. The high frequency of memory-intensive kernels like `im2col_opt` and `gemm_opt` suggests the workload may be memory-bound.
### Interpretation
This timeline chart is a diagnostic tool for performance optimization of a deep learning model's training process. The data reveals the following:
* **Performance Bottleneck Identification:** The overwhelming density of `gemm_opt` and `im2col_opt` executions indicates these are the primary targets for optimization. Any improvement in their efficiency (e.g., through better tiling, use of tensor cores, or algorithmic changes) would yield the greatest overall speedup.
* **Kernel Launch Overhead:** The extremely high frequency of short-duration kernels (the dense blue bands) suggests significant kernel launch overhead. Batching operations or fusing multiple small kernels into fewer, larger ones could reduce this overhead and improve performance.
* **Pipeline Analysis:** The synchronized bursts of auxiliary kernels (pooling, normalization, etc.) show the sequential dependencies in the training pipeline. There may be opportunities to overlap these operations with the dominant GEMM computations to improve hardware utilization.
* **Tool Context:** The specific kernel names (`gemm_opt`, `im2col_opt`, `col2im_opt`) are characteristic of optimized deep learning libraries. The chart likely comes from a profiling session aimed at understanding the low-level execution behavior of a convolutional neural network (CNN) or similar architecture during training.
In summary, this image provides a detailed temporal map of a computational workload, highlighting the dominance of linear algebra operations and revealing the structured, iterative nature of the underlying algorithm, which is almost certainly a deep learning training iteration.