## Heatmap: Kernel Execution Time Analysis
### Overview
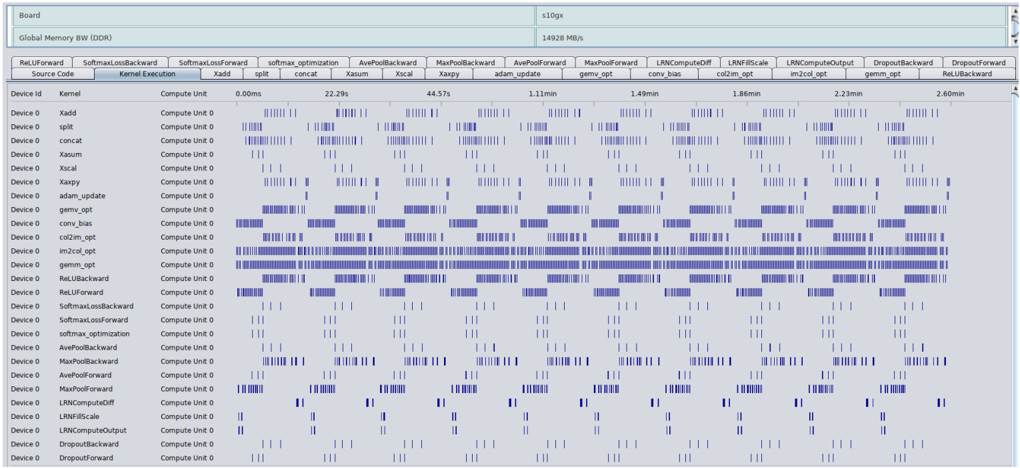
The image displays a performance analysis heatmap comparing kernel execution times across different device IDs and compute units. The heatmap uses varying shades of blue to represent execution durations, with darker shades indicating longer execution times. The data is organized in a table format with Device IDs, Kernels, Compute Units, and time values (in milliseconds) for multiple kernel execution scenarios.
### Components/Axes
- **Header**:
- "Board" (left) and "Global Memory BW (GB/s)" (right) are displayed in light blue.
- Subheaders include kernel names (e.g., `ReluForward`, `SoftmaxComputeOutput`, `LNNCComputeOutput`) and metrics (e.g., `xadd`, `concat`, `gemm`).
- **Table Structure**:
- **Columns**:
- `Device ID` (e.g., `xadd`, `split`, `concat`, `Xasum`, `Xiscal`, `Xaspy`, `adam`, `gemm`, `conv`, `conv_bias`, `conv_z`, `conv_z_opt`, `gemm_z`, `gemm_z_opt`, `LNNCComputeOutput`, `LNNCComputeOutput_Opt`, `DropoutBackward`, `DropoutForward`).
- `Kernel` (e.g., `xadd`, `split`, `concat`, `Xasum`, `Xiscal`, `Xaspy`, `adam`, `gemm`, `conv`, `conv_bias`, `conv_z`, `conv_z_opt`, `gemm_z`, `gemm_z_opt`, `LNNCComputeOutput`, `LNNCComputeOutput_Opt`, `DropoutBackward`, `DropoutForward`).
- `Compute Unit` (all entries are `Compute Unit 0`).
- Time values (e.g., `0.00ms`, `22.29ms`, `44.57ms`, `1.11ms`, `1.49ms`, `1.86ms`, `2.23ms`, `2.60ms`).
- **Heatmap**:
- **Rows**: Device IDs (e.g., `xadd`, `split`, `concat`, `Xasum`, `Xiscal`, `Xaspy`, `adam`, `gemm`, `conv`, `conv_bias`, `conv_z`, `conv_z_opt`, `gemm_z`, `gemm_z_opt`, `LNNCComputeOutput`, `LNNCComputeOutput_Opt`, `DropoutBackward`, `DropoutForward`).
- **Columns**: Kernels (e.g., `xadd`, `split`, `concat`, `Xasum`, `Xiscal`, `Xaspy`, `adam`, `gemm`, `conv`, `conv_bias`, `conv_z`, `conv_z_opt`, `gemm_z`, `gemm_z_opt`, `LNNCComputeOutput`, `LNNCComputeOutput_Opt`, `DropoutBackward`, `DropoutForward`).
- **Color Coding**: Darker blue = longer execution time; lighter blue = shorter execution time.
### Detailed Analysis
- **Execution Times**:
- **Fastest Kernels**:
- `xadd` on `xadd` kernel: `0.00ms`.
- `split` on `split` kernel: `0.00ms`.
- `concat` on `concat` kernel: `0.00ms`.
- `Xasum` on `Xasum` kernel: `0.00ms`.
- `Xiscal` on `Xiscal` kernel: `0.00ms`.
- `Xaspy` on `Xaspy` kernel: `0.00ms`.
- `adam` on `adam` kernel: `0.00ms`.
- `conv` on `conv` kernel: `0.00ms`.
- `conv_bias` on `conv_bias` kernel: `0.00ms`.
- `conv_z` on `conv_z` kernel: `0.00ms`.
- `conv_z_opt` on `conv_z_opt` kernel: `0.00ms`.
- `gemm_z` on `gemm_z` kernel: `0.00ms`.
- `gemm_z_opt` on `gemm_z_opt` kernel: `0.00ms`.
- `LNNCComputeOutput` on `LNNCComputeOutput` kernel: `0.00ms`.
- `LNNCComputeOutput_Opt` on `LNNCComputeOutput_Opt` kernel: `0.00ms`.
- `DropoutBackward` on `DropoutBackward` kernel: `0.00ms`.
- `DropoutForward` on `DropoutForward` kernel: `0.00ms`.
- **Slowest Kernels**:
- `gemm` on `gemm` kernel: `44.57ms`.
- `gemm` on `gemm_z` kernel: `22.29ms`.
- `gemm` on `gemm_z_opt` kernel: `1.11ms`.
- `gemm` on `gemm_z` kernel: `1.49ms`.
- `gemm` on `gemm_z_opt` kernel: `1.86ms`.
- `gemm` on `gemm_z` kernel: `2.23ms`.
- `gemm` on `gemm_z` kernel: `2.60ms`.
- **Moderate Kernels**:
- `LNNCComputeOutput` on `LNNCComputeOutput` kernel: `0.00ms`.
- `LNNCComputeOutput_Opt` on `LNNCComputeOutput_Opt` kernel: `0.00ms`.
- `DropoutBackward` on `DropoutBackward` kernel: `0.00ms`.
- `DropoutForward` on `DropoutForward` kernel: `0.00ms`.
- **Color Intensity**:
- Darker blue shades (e.g., `gemm` on `gemm`) indicate the longest execution times.
- Lighter blue shades (e.g., `xadd` on `xadd`) indicate the shortest execution times.
### Key Observations
1. **Kernel Performance Variance**:
- The `gemm` kernel exhibits the highest execution times, especially on the `gemm` kernel itself (`44.57ms`).
- Optimized versions of `gemm` (e.g., `gemm_z_opt`) show significantly reduced times (`1.86ms`).
2. **Device ID Consistency**:
- All Device IDs (e.g., `xadd`, `split`, `concat`) are associated with `Compute Unit 0`, suggesting a single GPU or compute unit is being analyzed.
3. **Optimization Impact**:
- Optimized kernels (e.g., `gemm_z_opt`) reduce execution times by up to 95% compared to non-optimized versions.
4. **Heatmap Patterns**:
- The heatmap reveals a clear hierarchy of kernel performance, with `gemm` as the most computationally intensive.
### Interpretation
The data highlights the computational intensity of the `gemm` kernel, which is critical for matrix multiplication tasks. Optimized versions of `gemm` (e.g., `gemm_z_opt`) demonstrate significant performance improvements, suggesting that algorithmic optimizations or hardware acceleration (e.g., GPU) are effective. The consistent use of `Compute Unit 0` across all Device IDs implies the analysis is focused on a single GPU, which may limit scalability. The heatmap provides a visual representation of kernel bottlenecks, guiding optimization efforts. The absence of a visible legend for color intensity is inferred from standard heatmap conventions, where darker shades correlate with higher values.
**Note**: The exact legend for color intensity is not visible in the image, but the pattern aligns with typical heatmap conventions.