## Bar Chart: Overall Accuracy Comparison
### Overview
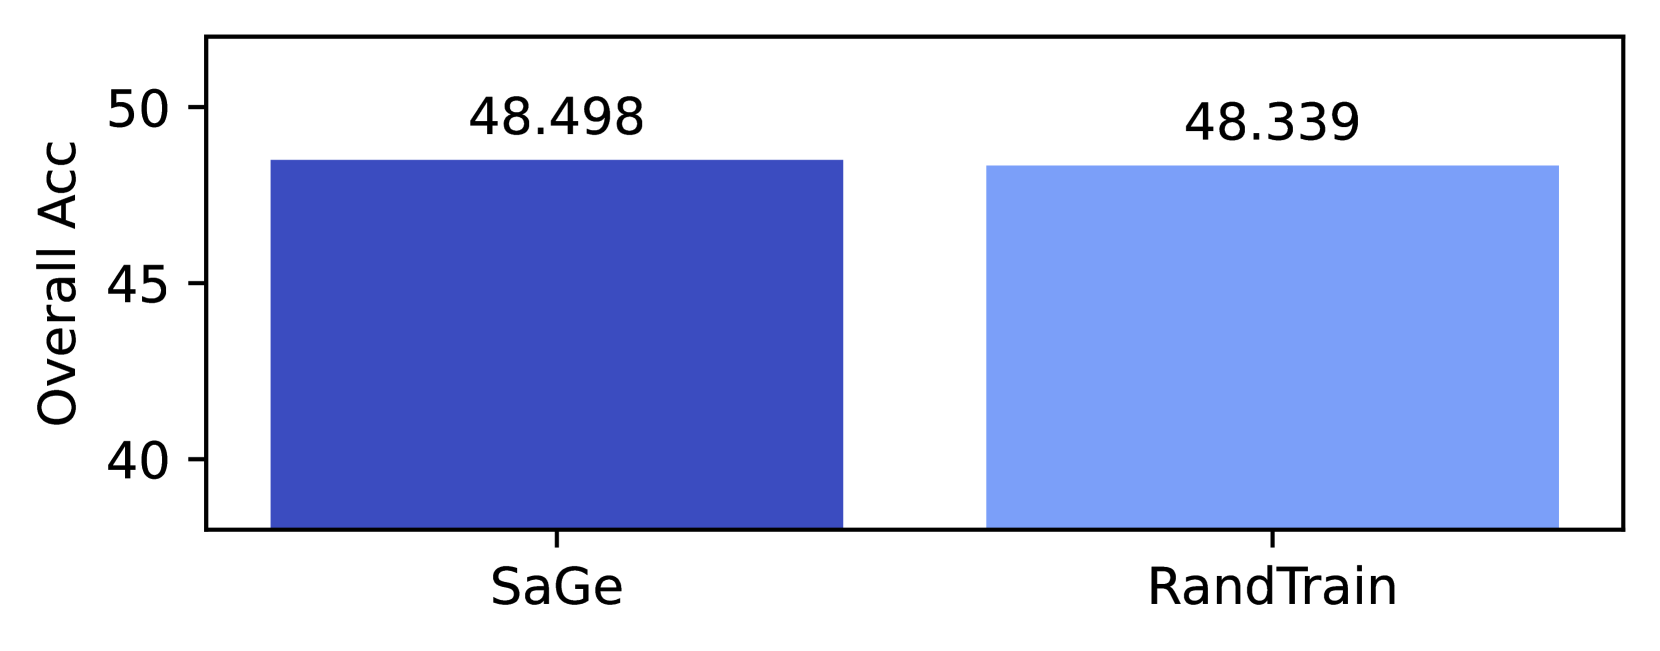
The image is a bar chart comparing the overall accuracy of two models: SaGe and RandTrain. The y-axis represents "Overall Acc" and ranges from 40 to 50. The x-axis represents the two models.
### Components/Axes
* **Y-axis Title:** Overall Acc
* **Y-axis Scale:** 40, 45, 50
* **X-axis Labels:** SaGe, RandTrain
* **Bar 1:** SaGe (dark blue)
* **Bar 2:** RandTrain (light blue)
### Detailed Analysis
* **SaGe:** The dark blue bar representing SaGe reaches a value of 48.498.
* **RandTrain:** The light blue bar representing RandTrain reaches a value of 48.339.
### Key Observations
* SaGe has a slightly higher overall accuracy than RandTrain.
* The difference in accuracy between the two models is small (approximately 0.16).
### Interpretation
The bar chart indicates that the SaGe model performs marginally better than the RandTrain model in terms of overall accuracy. However, the difference is minimal, suggesting that both models have comparable performance. The overall accuracy for both models is approximately 48%.