\n
## Bar Chart: Overall Accuracy Comparison
### Overview
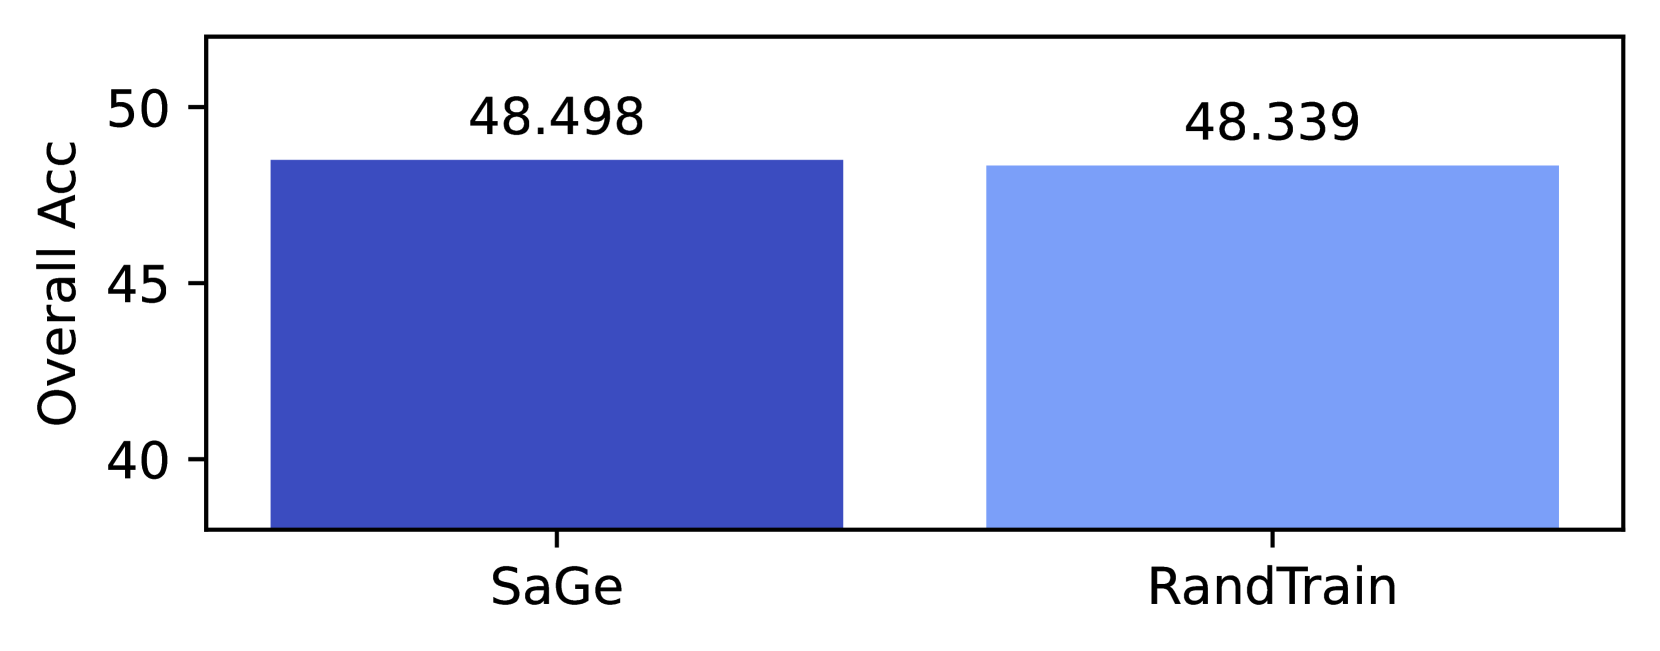
This image presents a bar chart comparing the "Overall ACC" (Accuracy) of two methods: "SaGe" and "RandTrain". The chart uses vertical bars to represent the accuracy values for each method.
### Components/Axes
* **X-axis:** Represents the methods being compared: "SaGe" and "RandTrain".
* **Y-axis:** Labeled "Overall ACC", representing the overall accuracy. The scale ranges from approximately 35 to 50, with markings at 40, 45, and 50.
* **Bars:** Two vertical bars, one for each method. The bar for "SaGe" is a darker shade of blue, while the bar for "RandTrain" is a lighter shade of blue.
* **Data Labels:** Each bar is labeled with its corresponding accuracy value.
### Detailed Analysis
* **SaGe:** The bar for "SaGe" reaches a height corresponding to approximately 48.498 on the "Overall ACC" scale. The bar is positioned on the left side of the chart.
* **RandTrain:** The bar for "RandTrain" reaches a height corresponding to approximately 48.339 on the "Overall ACC" scale. The bar is positioned on the right side of the chart.
* **Trend:** Both bars are of similar height, indicating comparable accuracy levels between the two methods. "SaGe" has a slightly higher accuracy than "RandTrain".
### Key Observations
* The accuracy values for both methods are very close to each other.
* "SaGe" exhibits a marginally higher accuracy compared to "RandTrain".
* The difference in accuracy between the two methods is relatively small (approximately 0.16).
### Interpretation
The data suggests that both "SaGe" and "RandTrain" achieve similar levels of overall accuracy. While "SaGe" demonstrates a slightly better performance, the difference is not substantial. This could indicate that both methods are effective for the task at hand, or that the specific dataset used does not significantly favor one method over the other. Further investigation with different datasets or parameter settings might reveal more pronounced differences in performance. The chart provides a direct comparison of the two methods' accuracy, allowing for a quick assessment of their relative effectiveness.