## Diagram: Sparse GPT-2 vs. GPT-2 (baseline)
### Overview
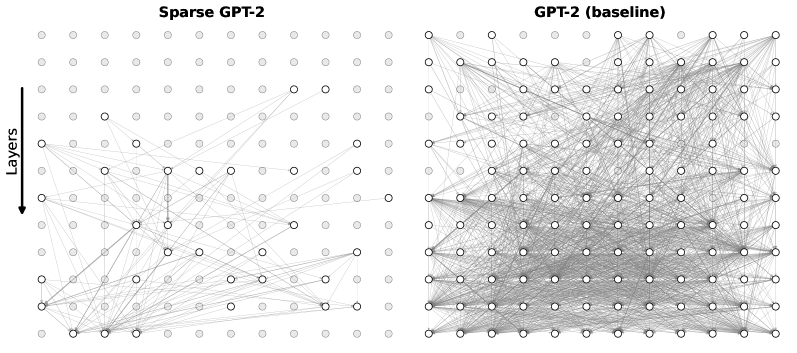
The image presents two diagrams side-by-side, visually comparing the connectivity patterns of a "Sparse GPT-2" model and a "GPT-2 (baseline)" model. Each diagram represents the layers of the model as a grid of nodes, with connections between nodes indicated by lines. The "Sparse GPT-2" diagram shows fewer connections than the "GPT-2 (baseline)" diagram, illustrating the sparsity of the former.
### Components/Axes
* **Title (Left Diagram):** Sparse GPT-2
* **Title (Right Diagram):** GPT-2 (baseline)
* **Y-axis Label:** Layers (with a downward-pointing arrow indicating the direction of increasing layer depth)
* **Nodes:** Represented by circles. Some nodes are filled with light gray, while others are white with a black outline.
* **Connections:** Represented by thin gray lines connecting the nodes.
### Detailed Analysis
**Left Diagram: Sparse GPT-2**
* The diagram is an 8x8 grid of nodes.
* The Y-axis "Layers" has an arrow pointing downwards, implying the layers increase in depth from top to bottom.
* Many nodes are filled with light gray, while some are white with a black outline.
* The connections between nodes are sparse, with most nodes having only a few connections.
* There appears to be a higher concentration of connections towards the bottom layers.
* There are some vertical connections between nodes in adjacent layers.
**Right Diagram: GPT-2 (baseline)**
* The diagram is an 8x8 grid of nodes.
* The Y-axis "Layers" is implied to be the same as the left diagram.
* Many nodes are filled with light gray, while some are white with a black outline.
* The connections between nodes are dense, with most nodes having many connections.
* The connections appear to be more evenly distributed across the layers compared to the "Sparse GPT-2" diagram.
### Key Observations
* The "Sparse GPT-2" model has significantly fewer connections than the "GPT-2 (baseline)" model, as indicated by the sparser network of lines.
* The "Sparse GPT-2" model seems to have a higher concentration of connections in the lower layers.
* The "GPT-2 (baseline)" model has a more uniform distribution of connections across all layers.
* The nodes that are white with a black outline seem to be the active nodes, while the gray nodes are inactive.
### Interpretation
The diagrams visually demonstrate the difference in connectivity between a sparse GPT-2 model and a baseline GPT-2 model. The sparsity in the "Sparse GPT-2" model suggests a deliberate reduction in the number of connections, potentially to improve efficiency, reduce computational cost, or prevent overfitting. The concentration of connections in the lower layers of the "Sparse GPT-2" model might indicate that these layers are more crucial for feature extraction or initial processing. The "GPT-2 (baseline)" model, with its dense connections, represents a more traditional, fully connected architecture. The comparison highlights the architectural differences and the potential trade-offs between sparsity and performance in language models.