## Diagram: Neural Network Connectivity Comparison
### Overview
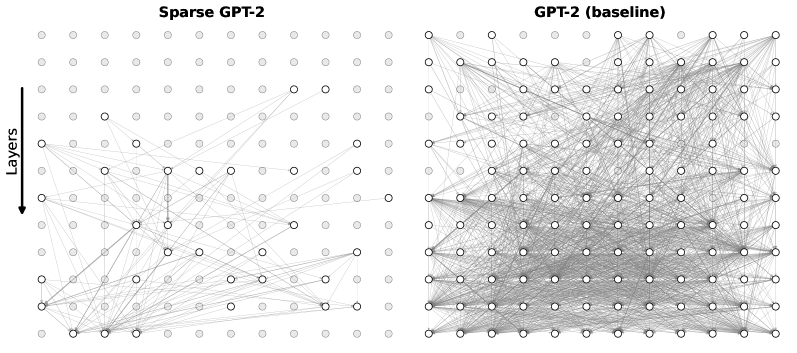
The image is a side-by-side comparison diagram illustrating the connectivity patterns between two versions of the GPT-2 language model architecture. It visually contrasts a "Sparse GPT-2" model with a standard "GPT-2 (baseline)" model, highlighting differences in the density of connections between nodes across layers.
### Components/Axes
* **Titles:**
* Left Panel: **"Sparse GPT-2"**
* Right Panel: **"GPT-2 (baseline)"**
* **Directional Indicator:** A vertical arrow on the far left, pointing downward, is labeled **"Layers"**. This indicates the flow of information or the hierarchical structure from top (likely input/earlier layers) to bottom (likely output/deeper layers).
* **Visual Elements:**
* **Nodes:** Represented by small circles arranged in a grid pattern (approximately 10 columns by 12 rows in each panel). Some nodes are filled (solid gray), while others are outlined (white interior with a gray border).
* **Connections:** Gray lines of varying opacity connect the nodes between different rows (layers).
### Detailed Analysis
* **Spatial Layout:** The diagram is split into two distinct, equally sized rectangular panels. The "Layers" arrow is positioned to the left of the "Sparse GPT-2" panel.
* **Node Distribution:** Both panels show an identical grid layout of nodes. The pattern of filled vs. outlined nodes appears similar between the two panels, suggesting the underlying node architecture is the same.
* **Connection Density - Primary Contrast:**
* **Sparse GPT-2 (Left Panel):** Connections are relatively few. Many nodes, especially in the upper half, have no visible connections. Connections that do exist are often isolated or form small, localized clusters. The overall visual impression is one of significant sparsity.
* **GPT-2 (baseline) (Right Panel):** Connections are extremely dense, forming a complex, tangled web. Nearly every node in the lower two-thirds of the grid is connected to multiple nodes in the rows above and below it. The density is so high that individual lines are difficult to trace, creating a gray mass, particularly in the central and lower regions.
### Key Observations
1. **Dramatic Sparsity Difference:** The most striking feature is the orders-of-magnitude difference in connection density between the two models. The baseline model is densely interconnected, while the sparse model has had the vast majority of its connections removed.
2. **Layer-wise Pattern:** In the sparse model, connections appear more prevalent in the lower (deeper) layers compared to the upper (earlier) layers. The baseline model shows high density throughout, but it is most intense in the middle and lower sections.
3. **Node Activity:** The pattern of filled vs. outlined nodes is consistent across both diagrams, implying that the sparsification process affects connections (edges) rather than the nodes themselves.
### Interpretation
This diagram is a powerful visual metaphor for **model pruning** or **sparsification** in neural networks.
* **What it Demonstrates:** It shows the structural result of applying a technique (like the "SparseGPT" method referenced in the title) to a dense, baseline transformer model (GPT-2). The technique identifies and removes a large percentage of synaptic connections (weights) that are deemed less critical for the model's performance.
* **Relationship Between Elements:** The "Layers" arrow establishes the hierarchical, feed-forward nature of the network. The comparison argues that a significant portion of the connections in the original, dense baseline model are redundant or unnecessary.
* **Implications:** The sparse model likely represents a more computationally efficient version that requires less memory and fewer operations for inference, potentially with minimal loss in accuracy. The visual starkness suggests the potential for extreme compression. The diagram doesn't show performance metrics, so the trade-off between sparsity and model capability is implied but not quantified here. The core message is the feasibility of achieving a radically simpler network structure from a complex starting point.