\n
## Diagram: Flowchart/Dependency Diagram
### Overview
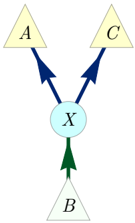
The image depicts a simple flowchart or dependency diagram showing relationships between four elements: A, B, C, and X. Arrows indicate the direction of influence or flow. There are no numerical values or scales present.
### Components/Axes
The diagram consists of:
* **Nodes:** Four shapes representing elements:
* A: Triangle, pale yellow fill.
* B: Triangle, pale green fill.
* C: Triangle, pale yellow fill.
* X: Circle, light blue fill.
* **Arrows:** Three arrows indicating direction:
* A to X: Dark blue arrow.
* C to X: Dark blue arrow.
* X to B: Dark green arrow.
### Detailed Analysis or Content Details
* Element A influences Element X.
* Element C influences Element X.
* Element X influences Element B.
* The diagram suggests a convergence of A and C onto X, and a divergence of X onto B.
* The arrows are directional, indicating a flow or dependency.
### Key Observations
The diagram is symmetrical in the sense that A and C have the same relationship to X. B is the sole recipient of influence from X. The color coding of the arrows (blue and green) may indicate different types of relationships, but this is not explicitly stated.
### Interpretation
This diagram likely represents a simplified model of a system where elements A and C contribute to or influence element X, which in turn affects element B. It could represent a process flow, a dependency graph in software engineering, or a causal relationship in a scientific model. The lack of quantitative data suggests the diagram is intended to illustrate the *structure* of the relationships rather than their *strength* or *magnitude*. The use of different arrow colors could indicate different types of dependencies (e.g., control flow vs. data flow), but without further context, this is speculative. The diagram is a high-level representation and does not provide details about the internal workings of each element or the specific mechanisms of influence.