## Diagram: Tree Structure with Nodes and Subtrees
### Overview
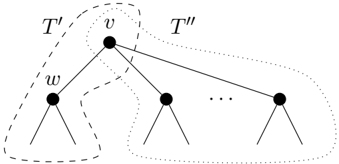
The image depicts a hierarchical tree structure with labeled nodes and subtrees. Key elements include:
- **Trees**: Labeled as \( T' \), \( T \), and \( T'' \).
- **Nodes**: Labeled \( v \) (central node) and \( w \) (left subtree).
- **Connections**: Dashed and solid lines indicate relationships between nodes and subtrees.
### Components/Axes
- **Labels**:
- \( T' \): Subtree rooted at \( w \), enclosed by a dashed boundary.
- \( T \): Main tree structure, partially overlapping with \( T' \).
- \( T'' \): Subtree extending from \( v \) to the right, enclosed by a dotted boundary.
- \( v \): Central node connecting \( T \) and \( T'' \).
- \( w \): Node in the left subtree \( T' \).
- **Lines**:
- Solid lines represent direct parent-child relationships.
- Dashed lines denote boundaries or subsets (e.g., \( T' \)).
- Dotted lines enclose \( T'' \).
### Detailed Analysis
- **Node \( v \)**: Positioned centrally, acting as a junction between \( T \) and \( T'' \).
- **Node \( w \)**: Located in the left subtree \( T' \), connected to \( v \) via a solid line.
- **Subtree \( T' \)**: Contains \( w \) and its descendants, bounded by a dashed line.
- **Subtree \( T'' \)**: Extends from \( v \) to the right, bounded by a dotted line, with additional nodes implied by ellipsis ("...").
### Key Observations
1. **Hierarchical Relationships**:
- \( T' \) and \( T'' \) appear to be subtrees of \( T \), with \( v \) as a shared ancestor.
- \( w \) is a descendant of \( v \) within \( T' \).
2. **Boundary Indicators**:
- Dashed lines for \( T' \) suggest a subset or partition of \( T \).
- Dotted lines for \( T'' \) imply a distinct but connected component.
3. **Ellipsis ("...")**: Indicates additional nodes in \( T'' \) beyond those explicitly shown.
### Interpretation
The diagram likely represents a **tree decomposition** or **subtree partitioning** in a hierarchical data structure. Key insights:
- **Central Node \( v \)**: Serves as a critical connector, linking the main tree \( T \) to the extended subtree \( T'' \).
- **Subtree Boundaries**: Dashed and dotted lines visually distinguish \( T' \) and \( T'' \), suggesting modular or isolated components within \( T \).
- **Node \( w \)**: Positioned in \( T' \), it may represent a specific branch or subset of data within the larger structure.
The absence of numerical data or explicit trends implies the focus is on **structural relationships** rather than quantitative analysis. This could model concepts like organizational hierarchies, phylogenetic trees, or computational data structures (e.g., binary trees with annotated subtrees).