## Diagram: Tree Structure with Subtrees
### Overview
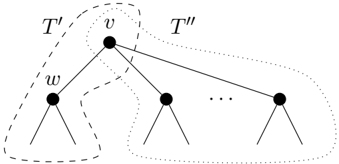
The image depicts a tree structure with labeled nodes and subtrees. It illustrates a hierarchical relationship between nodes, with specific nodes and subtrees highlighted using dashed and dotted lines.
### Components/Axes
* **Nodes:** Represented by black circles.
* **Edges:** Represented by solid black lines connecting the nodes.
* **Labels:**
* `v`: Label for the root node.
* `w`: Label for a node in the left subtree.
* `T'`: Label for the subtree enclosed by a dashed line.
* `T''`: Label for the subtree enclosed by a dotted line.
* `...`: Ellipsis indicating potentially more nodes or subtrees.
* **Subtrees:**
* Subtree `T'` is enclosed by a dashed line.
* Subtree `T''` is enclosed by a dotted line.
### Detailed Analysis
The diagram shows a tree with a root node labeled `v`. From node `v`, there are multiple branches leading to other nodes. One branch leads to node `w`, which is part of subtree `T'`. The subtree `T'` is enclosed by a dashed line. Another branch leads to a subtree `T''`, which is enclosed by a dotted line. The subtree `T''` contains an ellipsis (`...`), indicating that there may be more nodes or subtrees within it.
Specifically:
* Node `v` is the root of the entire tree.
* Node `w` is a child of `v` and the root of a smaller subtree within `T'`.
* Subtree `T'` includes node `w` and its descendants.
* Subtree `T''` includes at least two nodes connected to `v`, with an ellipsis suggesting more.
### Key Observations
* The diagram highlights two distinct subtrees, `T'` and `T''`, originating from the root node `v`.
* The use of dashed and dotted lines clearly distinguishes the boundaries of these subtrees.
* The ellipsis in subtree `T''` indicates an unspecified number of additional nodes or subtrees.
### Interpretation
The diagram likely represents a step in an algorithm or a proof involving tree structures. The subtrees `T'` and `T''` might represent different cases or partitions of the original tree. The ellipsis suggests that the analysis or algorithm is generalizable to trees with varying numbers of branches and nodes. The diagram is a visual aid to understand the relationships between different parts of the tree and how they are being considered in the context of the problem being addressed.