## Stacked Bar Chart: Search Methods by Category
### Overview
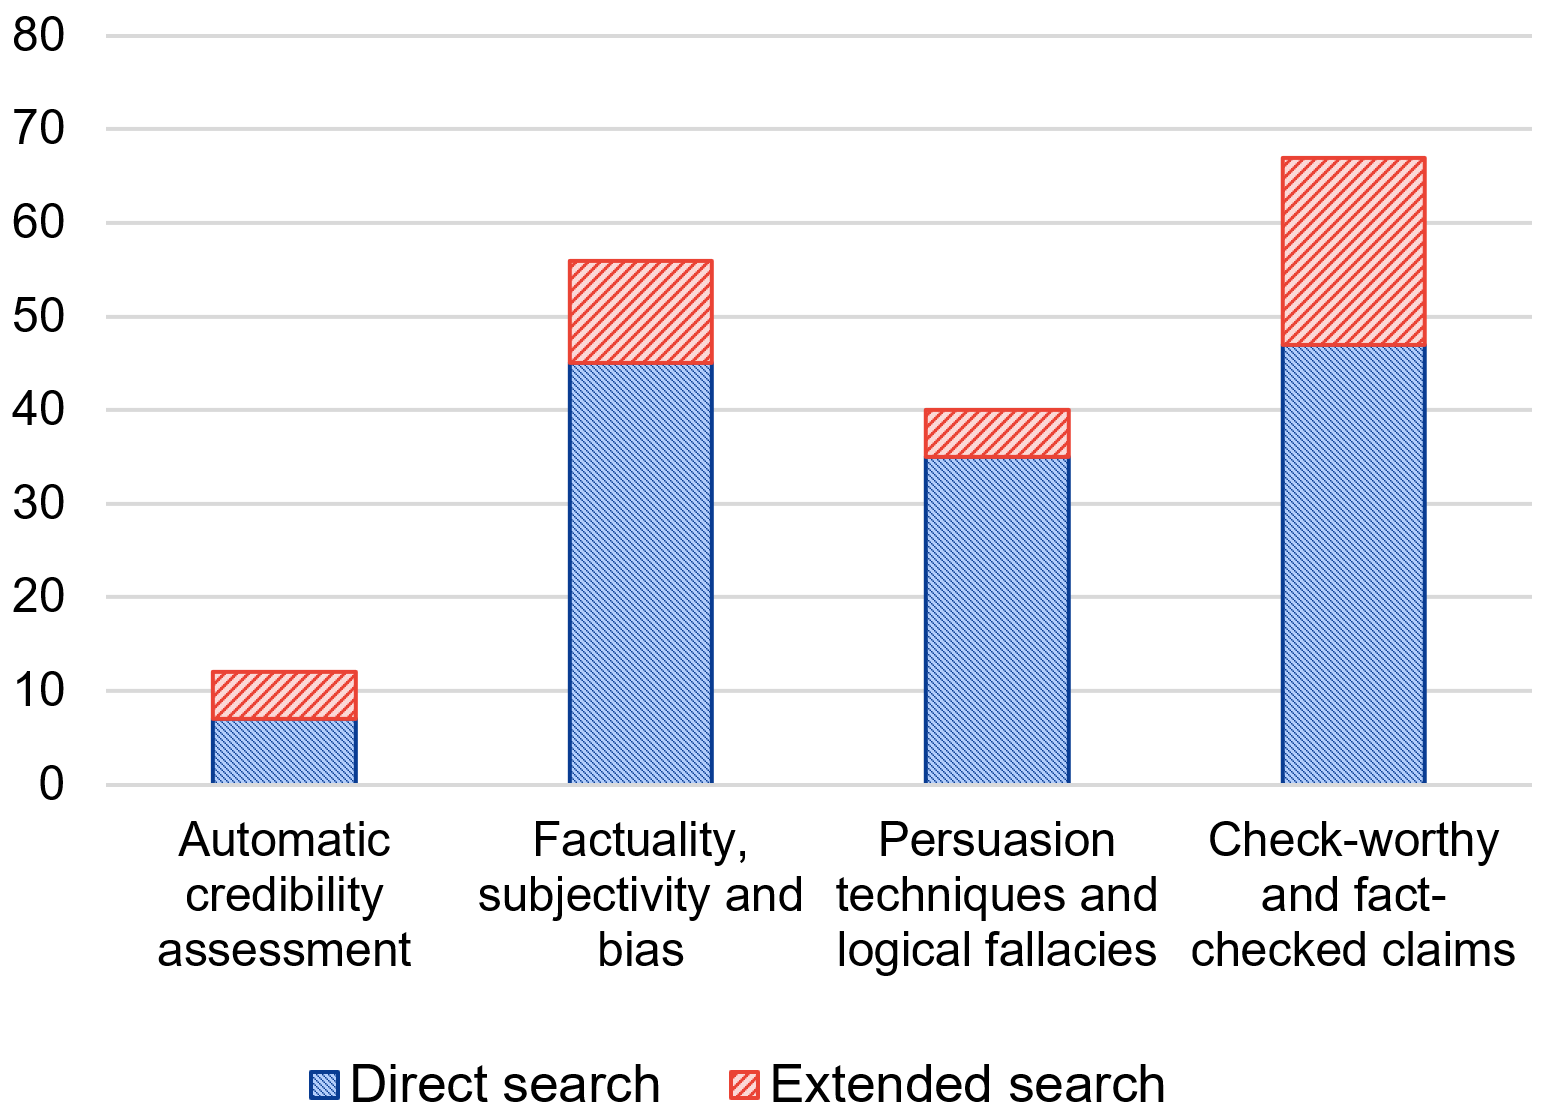
The image is a stacked bar chart comparing the usage of "Direct search" and "Extended search" across four categories: "Automatic credibility assessment", "Factuality, subjectivity and bias", "Persuasion techniques and logical fallacies", and "Check-worthy and fact-checked claims". The y-axis represents a numerical value, but the units are not specified. The chart uses blue bars to represent "Direct search" and red hatched bars to represent "Extended search".
### Components/Axes
* **X-axis:** Categorical axis with four categories:
* Automatic credibility assessment
* Factuality, subjectivity and bias
* Persuasion techniques and logical fallacies
* Check-worthy and fact-checked claims
* **Y-axis:** Numerical axis ranging from 0 to 80, with increments of 10.
* **Legend:** Located at the bottom of the chart.
* Blue bar: Direct search
* Red hatched bar: Extended search
### Detailed Analysis
* **Automatic credibility assessment:**
* Direct search: Approximately 7
* Extended search: Approximately 5
* Total: Approximately 12
* **Factuality, subjectivity and bias:**
* Direct search: Approximately 45
* Extended search: Approximately 11
* Total: Approximately 56
* **Persuasion techniques and logical fallacies:**
* Direct search: Approximately 35
* Extended search: Approximately 5
* Total: Approximately 40
* **Check-worthy and fact-checked claims:**
* Direct search: Approximately 47
* Extended search: Approximately 20
* Total: Approximately 67
### Key Observations
* "Direct search" is used more frequently than "Extended search" in all categories.
* "Check-worthy and fact-checked claims" has the highest total usage, followed by "Factuality, subjectivity and bias".
* "Automatic credibility assessment" has the lowest total usage.
* The difference between "Direct search" and "Extended search" is most pronounced in "Factuality, subjectivity and bias" and "Check-worthy and fact-checked claims".
### Interpretation
The chart suggests that "Direct search" is the preferred method across all categories related to credibility assessment, fact-checking, and logical fallacies. The higher usage in "Factuality, subjectivity and bias" and "Check-worthy and fact-checked claims" may indicate that direct search is more effective or efficient for these types of tasks. The relatively low usage in "Automatic credibility assessment" could reflect the limitations or challenges associated with automated methods. The data implies that while extended search is used, it is not as prevalent as direct search in these contexts.