\n
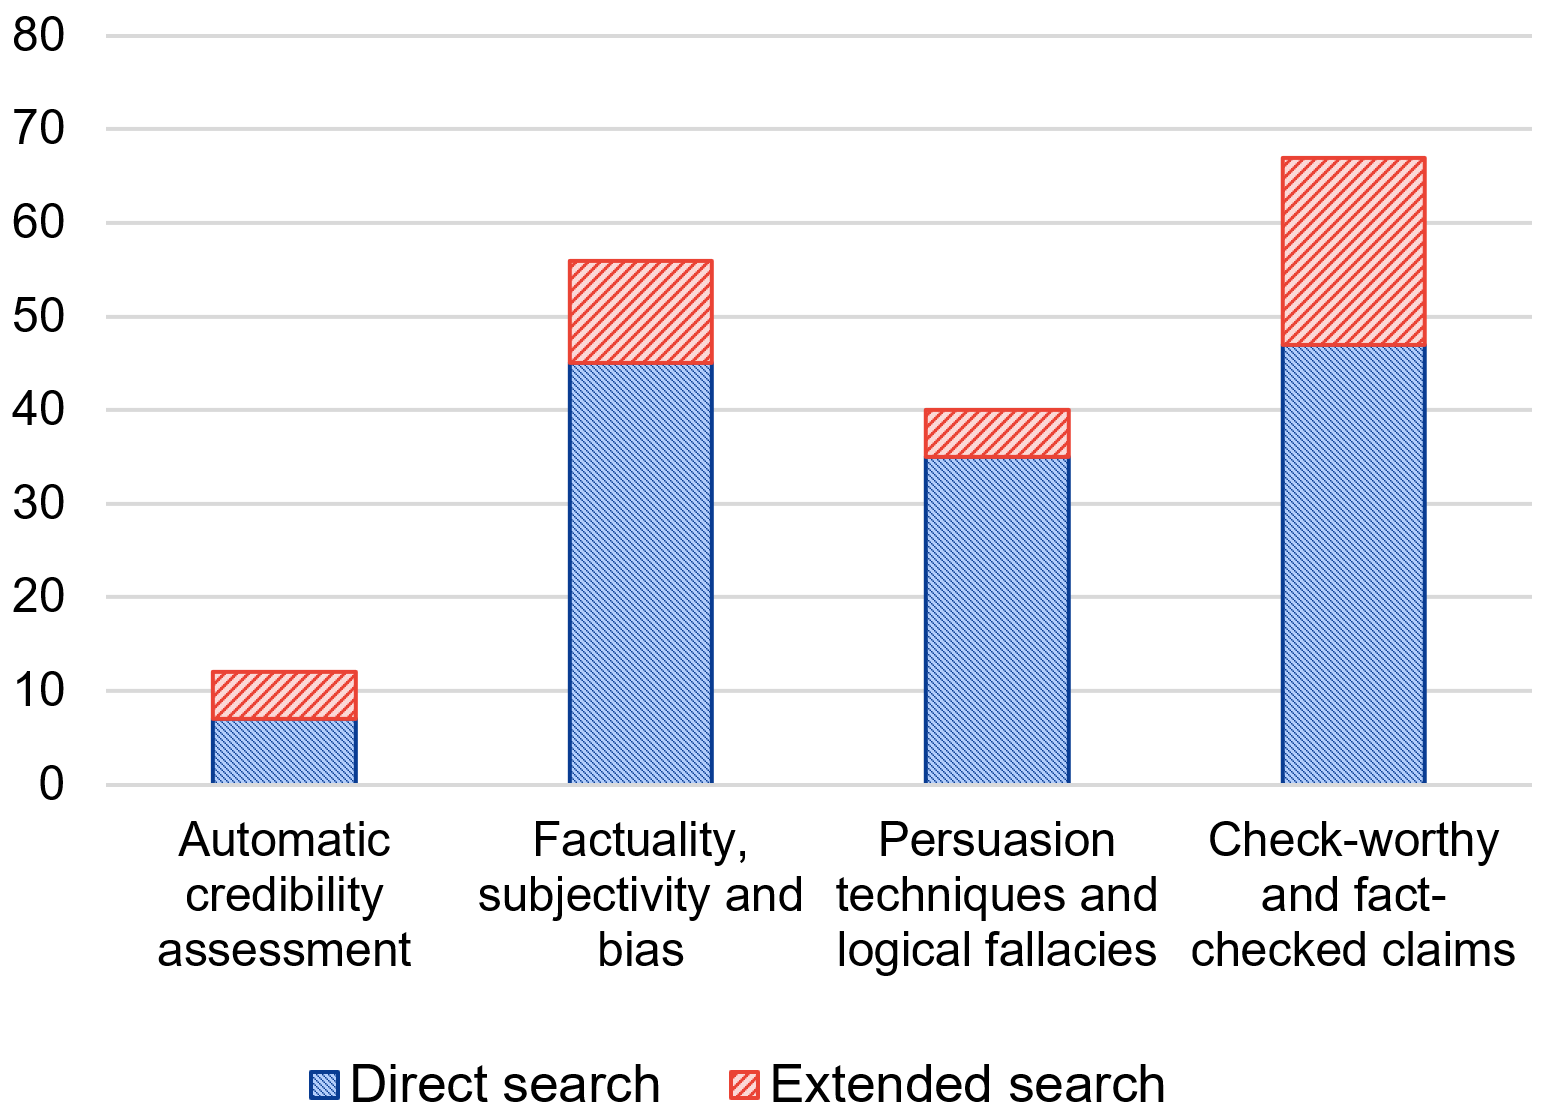
## Bar Chart: Search Result Counts by Category and Search Type
### Overview
This is a bar chart comparing the number of search results obtained using "Direct search" versus "Extended search" across four different categories related to information quality and verification. The y-axis represents the count of search results, ranging from 0 to 80. The x-axis represents the four categories: "Automatic credibility assessment", "Factuality, subjectivity and bias", "Persuasion techniques and logical fallacies", and "Check-worthy and fact-checked claims". Each category has two bars, one for "Direct search" (blue) and one for "Extended search" (red).
### Components/Axes
* **X-axis Title:** Categories of information quality/verification.
* **Y-axis Title:** Count of search results (0-80).
* **Legend:** Located at the bottom-center of the chart.
* "Direct search" - Blue color
* "Extended search" - Red color
* **Categories:**
* Automatic credibility assessment
* Factuality, subjectivity and bias
* Persuasion techniques and logical fallacies
* Check-worthy and fact-checked claims
### Detailed Analysis
Let's analyze each category individually:
1. **Automatic credibility assessment:**
* Direct search: Approximately 8 results. The blue bar reaches the 8 mark on the y-axis.
* Extended search: Approximately 12 results. The red bar reaches the 12 mark on the y-axis.
2. **Factuality, subjectivity and bias:**
* Direct search: Approximately 45 results. The blue bar reaches the 45 mark on the y-axis.
* Extended search: Approximately 55 results. The red bar reaches the 55 mark on the y-axis.
3. **Persuasion techniques and logical fallacies:**
* Direct search: Approximately 40 results. The blue bar reaches the 40 mark on the y-axis.
* Extended search: Approximately 42 results. The red bar reaches the 42 mark on the y-axis.
4. **Check-worthy and fact-checked claims:**
* Direct search: Approximately 50 results. The blue bar reaches the 50 mark on the y-axis.
* Extended search: Approximately 65 results. The red bar reaches the 65 mark on the y-axis.
### Key Observations
* Extended search consistently yields more results than direct search across all categories.
* The largest difference between direct and extended search is observed in the "Check-worthy and fact-checked claims" category (a difference of approximately 15 results).
* The smallest difference is observed in the "Persuasion techniques and logical fallacies" category (a difference of approximately 2 results).
* "Automatic credibility assessment" has the lowest overall result counts for both search types.
### Interpretation
The data suggests that utilizing an "Extended search" strategy significantly increases the number of relevant results when researching topics related to information quality and verification. This is particularly noticeable when seeking "Check-worthy and fact-checked claims," indicating that extended search methods are more effective at uncovering resources related to fact-checking. The relatively low result counts for "Automatic credibility assessment" might suggest that this is a less frequently researched area, or that existing resources are less easily discoverable through standard search methods. The consistent improvement from extended search implies that the extended search incorporates more sources or uses more sophisticated search algorithms to find relevant information. The chart highlights the importance of employing comprehensive search strategies when evaluating information credibility and combating misinformation.