## Diagram: Progressive Image Segmentation/Noise Addition on a Handwritten Digit
### Overview
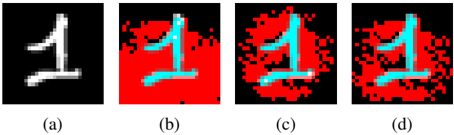
The image displays a sequence of four panels, labeled (a) through (d), demonstrating a progressive visual transformation of a handwritten digit "1". The sequence appears to illustrate a process, likely related to image segmentation, noise addition, or the visualization of a classification algorithm's confidence or error regions. The primary change across the panels is the increasing coverage of red-colored pixels in the background surrounding the digit.
### Components/Axes
* **Panel Labels:** Each panel is labeled with a lowercase letter in parentheses, positioned at the bottom center of each sub-image: `(a)`, `(b)`, `(c)`, `(d)`.
* **Image Content:** Each panel contains a pixelated representation of the digit "1" on a background.
* **Color Scheme:**
* **Digit Color:** In panels (b), (c), and (d), the digit is rendered in a bright cyan/light blue color. In panel (a), it is in grayscale (white/light gray).
* **Background Color:** The background transitions from solid black in (a) to an increasing mixture of black and red pixels in (b), (c), and (d).
* **Spatial Layout:** The four panels are arranged in a single horizontal row. Each panel is a square of equal size.
### Detailed Analysis
**Panel-by-Panel Breakdown:**
1. **Panel (a):**
* **Content:** A clean, grayscale image of a handwritten digit "1". The digit is composed of white and light gray pixels against a solid black background.
* **Trend/State:** This represents the original or reference image.
2. **Panel (b):**
* **Content:** The digit "1" is now colored cyan. A significant portion of the background, primarily in the lower-left and extending upwards, has been replaced with solid red pixels. The red area forms a rough, contiguous shape behind the digit.
* **Trend:** Introduction of a red region, suggesting an initial segmentation mask, a region of interest, or the first stage of noise/error visualization.
3. **Panel (c):**
* **Content:** The cyan digit remains. The red background region has expanded and become more fragmented. Red pixels now surround the digit more completely, with scattered red pixels (noise) appearing in the previously black areas, especially in the top-right and bottom-right corners.
* **Trend:** The red region is growing and becoming less contiguous, indicating increased "activity," noise, or uncertainty spreading from the initial region.
4. **Panel (d):**
* **Content:** The cyan digit is still visible. The background is now a dense, noisy mixture of red and black pixels. The red coverage is more extensive and scattered than in (c), with very few large contiguous black areas remaining.
* **Trend:** The process has reached a state of high dispersion, where the red "noise" or segmentation mask pervades almost the entire background.
### Key Observations
* **Progressive Change:** There is a clear, monotonic increase in the density and scatter of red pixels from panel (b) to (d).
* **Digit Consistency:** The shape and position of the core digit "1" remain consistent across all four panels, serving as a fixed reference point.
* **Color Function:** The color shift from grayscale (a) to cyan (b-d) for the digit likely serves to visually separate the digit from the changing background for clarity.
* **Pattern of Spread:** The red pixels do not appear random; they seem to emanate from or cluster around the digit, suggesting a process related to the digit's features (e.g., a segmentation algorithm expanding from edges, or adversarial noise targeting the classification of the digit).
### Interpretation
This diagram visually narrates a technical process, most likely from the field of computer vision or machine learning. The sequence demonstrates how an algorithm interacts with an input image over successive steps.
* **What it Suggests:** The progression from a clean image (a) to a heavily "contaminated" one (d) could illustrate:
1. **Adversarial Attack:** The red pixels may represent adversarial perturbations being added to the image to fool a classifier, showing how minimal noise can escalate to widespread corruption.
2. **Segmentation/Uncertainty Visualization:** The red could highlight pixels that a model is uncertain about or has classified as "background" versus "foreground" (the digit). The increase shows growing uncertainty or a refining segmentation mask.
3. **Noise Robustness Test:** It may show a test where synthetic noise (red) is incrementally added to evaluate how well a digit recognition system performs under deteriorating conditions.
* **Relationships:** The fixed cyan digit is the constant subject. The variable red background is the manipulated condition. The relationship is one of increasing interference or analysis applied to the subject.
* **Anomalies/Notable Points:** The most notable pattern is the non-uniform, clustered spread of the red pixels. They are not uniformly distributed random noise but appear to have a spatial correlation with the digit's structure, which is a key insight into the underlying process being visualized. The transition from the solid red block in (b) to the scattered noise in (c) and (d) is particularly telling of a process that starts with a coarse region and becomes more granular or diffuse.