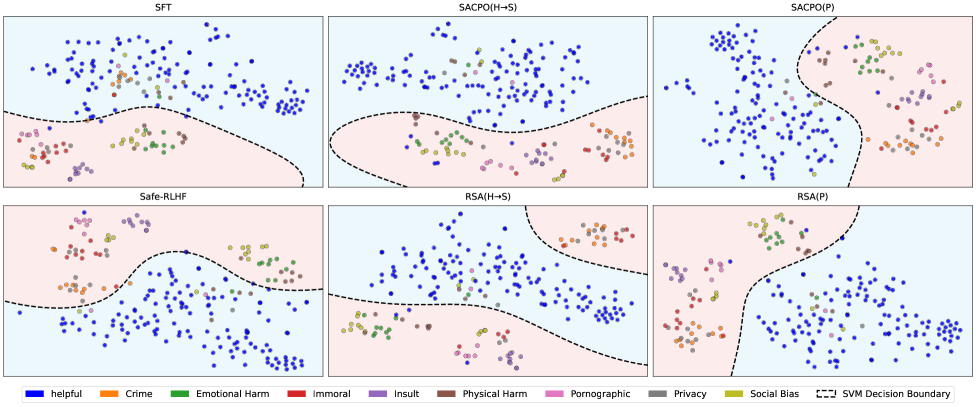
## Scatter Plot: Model Performance Comparison
### Overview
The image presents a series of scatter plots, each representing the performance of a different model (SFT, SACPO(H→S), SACPO(P), Safe-RLHF, RSA(H→S), RSA(P)). Each plot visualizes the distribution of data points categorized by different labels (helpful, crime, emotional harm, immoral, insult, physical harm, pornographic, privacy, social bias). The plots also show the SVM decision boundary, separating the data into two regions.
### Components/Axes
* **Titles:** Each plot has a title indicating the model used: SFT, SACPO(H→S), SACPO(P), Safe-RLHF, RSA(H→S), RSA(P).
* **Data Points:** Each data point is represented by a colored dot, with the color indicating the category it belongs to.
* **SVM Decision Boundary:** A dashed black line represents the SVM decision boundary, separating the data space into two regions.
* **Background Regions:** The background is divided into two colored regions, light blue and light pink, separated by the SVM decision boundary.
* **Legend (Bottom):**
* Blue: Helpful
* Orange: Crime
* Green: Emotional Harm
* Red: Immoral
* Purple: Insult
* Brown: Physical Harm
* Pink: Pornographic
* Gray: Privacy
* Yellow: Social Bias
* Black Dashed Line: SVM Decision Boundary
### Detailed Analysis
**SFT (Top-Left)**
* The majority of "helpful" (blue) data points are located in the top region (light blue background).
* "Immoral" (red) and "Insult" (purple) data points are primarily located in the bottom region (light pink background).
* Other categories are scattered in both regions.
**SACPO(H→S) (Top-Middle)**
* "Helpful" (blue) data points are concentrated in the top region.
* "Immoral" (red) data points are mostly in the bottom region.
* Other categories show a mixed distribution.
**SACPO(P) (Top-Right)**
* "Helpful" (blue) data points are predominantly in the top region.
* "Immoral" (red) data points are mostly in the bottom region.
* "Social Bias" (yellow) data points are clustered in the bottom region.
**Safe-RLHF (Bottom-Left)**
* "Helpful" (blue) data points are more evenly distributed across both regions compared to other models.
* "Immoral" (red) and "Insult" (purple) data points are mostly in the top region.
**RSA(H→S) (Bottom-Middle)**
* "Helpful" (blue) data points are mostly in the top region.
* "Immoral" (red) data points are mostly in the bottom region.
**RSA(P) (Bottom-Right)**
* "Helpful" (blue) data points are mostly in the top region.
* "Immoral" (red) data points are mostly in the bottom region.
* "Social Bias" (yellow) data points are clustered in the bottom region.
### Key Observations
* The "helpful" category (blue) tends to be associated with the top region (light blue background) across most models, suggesting that the models generally classify these data points similarly.
* The "immoral" category (red) tends to be associated with the bottom region (light pink background) across most models.
* The SVM decision boundary varies slightly between models, indicating differences in how each model separates the data.
* Safe-RLHF shows a different distribution of "helpful" data points compared to other models.
### Interpretation
The scatter plots visualize the performance of different models in classifying data points into various categories. The SVM decision boundary represents the model's attempt to separate the data into two distinct regions. The distribution of data points within these regions indicates how well each model is able to classify the data.
The consistent placement of "helpful" data points in the top region and "immoral" data points in the bottom region across most models suggests that these categories are relatively well-defined and easily classified. The variations in the SVM decision boundary and the distribution of other categories indicate differences in the models' ability to classify these more ambiguous data points.
Safe-RLHF's different distribution of "helpful" data points may indicate a different approach to classification or a different sensitivity to the features used to classify the data. The clustering of "social bias" data points in the bottom region for SACPO(P) and RSA(P) suggests that these models may be particularly sensitive to features associated with social bias.