## Scatter Plots: Model Classification Performance Across Harm Categories
### Overview
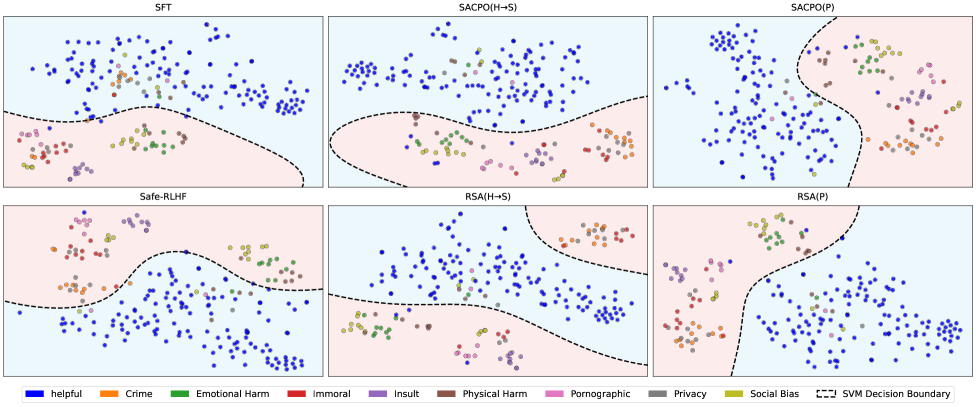
The image displays six scatter plots comparing classification performance of different AI safety models (SFT, SACPO, Safe-RLHF, RSA) across nine harm categories. Each plot visualizes data point distributions relative to an SVM decision boundary, with color-coded harm categories and model-specific decision boundaries.
### Components/Axes
- **Plots**:
- Top Row: SFT, SACPO(H→S), SACPO(P)
- Bottom Row: Safe-RLHF, RSA(H→S), RSA(P)
- **Legend** (bottom-center):
- Blue: Helpful
- Orange: Crime
- Green: Emotional Harm
- Red: Immoral
- Purple: Insult
- Brown: Physical Harm
- Pink: Pornographic
- Gray: Privacy
- Yellow: Social Bias
- **SVM Decision Boundary**: Dashed black line in all plots
### Detailed Analysis
1. **SFT Plot**:
- Helpful (blue) points dominate upper-left quadrant
- Harmful categories (orange, green, red) scattered throughout
- SVM boundary curves diagonally from bottom-left to upper-right
2. **SACPO(H→S)**:
- Similar blue dominance in upper-left
- Increased orange (crime) points near boundary
- Boundary curves more tightly around harmful categories
3. **SACPO(P)**:
- Most complex boundary with multiple inflection points
- Yellow (social bias) and pink (pornographic) points concentrated near boundary
- Higher density of gray (privacy) points in lower-right quadrant
4. **Safe-RLHF**:
- Smoothest boundary with clear separation
- Minimal overlap between helpful (blue) and harmful categories
- Fewer harmful points near boundary compared to other models
5. **RSA(H→S)**:
- Boundary curves around central cluster of harmful points
- Orange (crime) and red (immoral) points most prevalent near boundary
- Blue points concentrated in upper-right quadrant
6. **RSA(P)**:
- Most dispersed distribution
- Pink (pornographic) and yellow (social bias) points widely scattered
- Boundary forms irregular shape with multiple lobes
### Key Observations
- **Model Performance**: Safe-RLHF shows clearest separation between helpful and harmful categories
- **Boundary Complexity**: SACPO(P) exhibits most complex decision boundary
- **Harm Distribution**: Crime (orange) and social bias (yellow) consistently appear near decision boundaries across models
- **Privacy (gray) Points**: Concentrated in lower-right quadrant of SACPO(P) and RSA(P)
- **Model-Specific Patterns**: RSA(H→S) shows strongest clustering of harmful categories near boundary
### Interpretation
The SVM decision boundaries reveal critical insights about model robustness:
1. **Safe-RLHF's** smooth boundary suggests effective harm mitigation strategies
2. **SACPO(P)**'s complex boundary indicates potential overfitting to harmful content
3. The persistent presence of crime/social bias points near boundaries across models highlights systemic challenges in content moderation
4. Privacy category (gray) distribution patterns may reflect data leakage issues in certain architectures
5. The spatial distribution of harmful categories relative to boundaries provides actionable insights for model retraining priorities
Note: While no explicit numerical values are provided, the density and spatial distribution of points quantitatively imply classification confidence levels and error rates across harm categories.