## Line Graph: Mean Pass Rate vs. Mean Number of Tokens Generated
### Overview
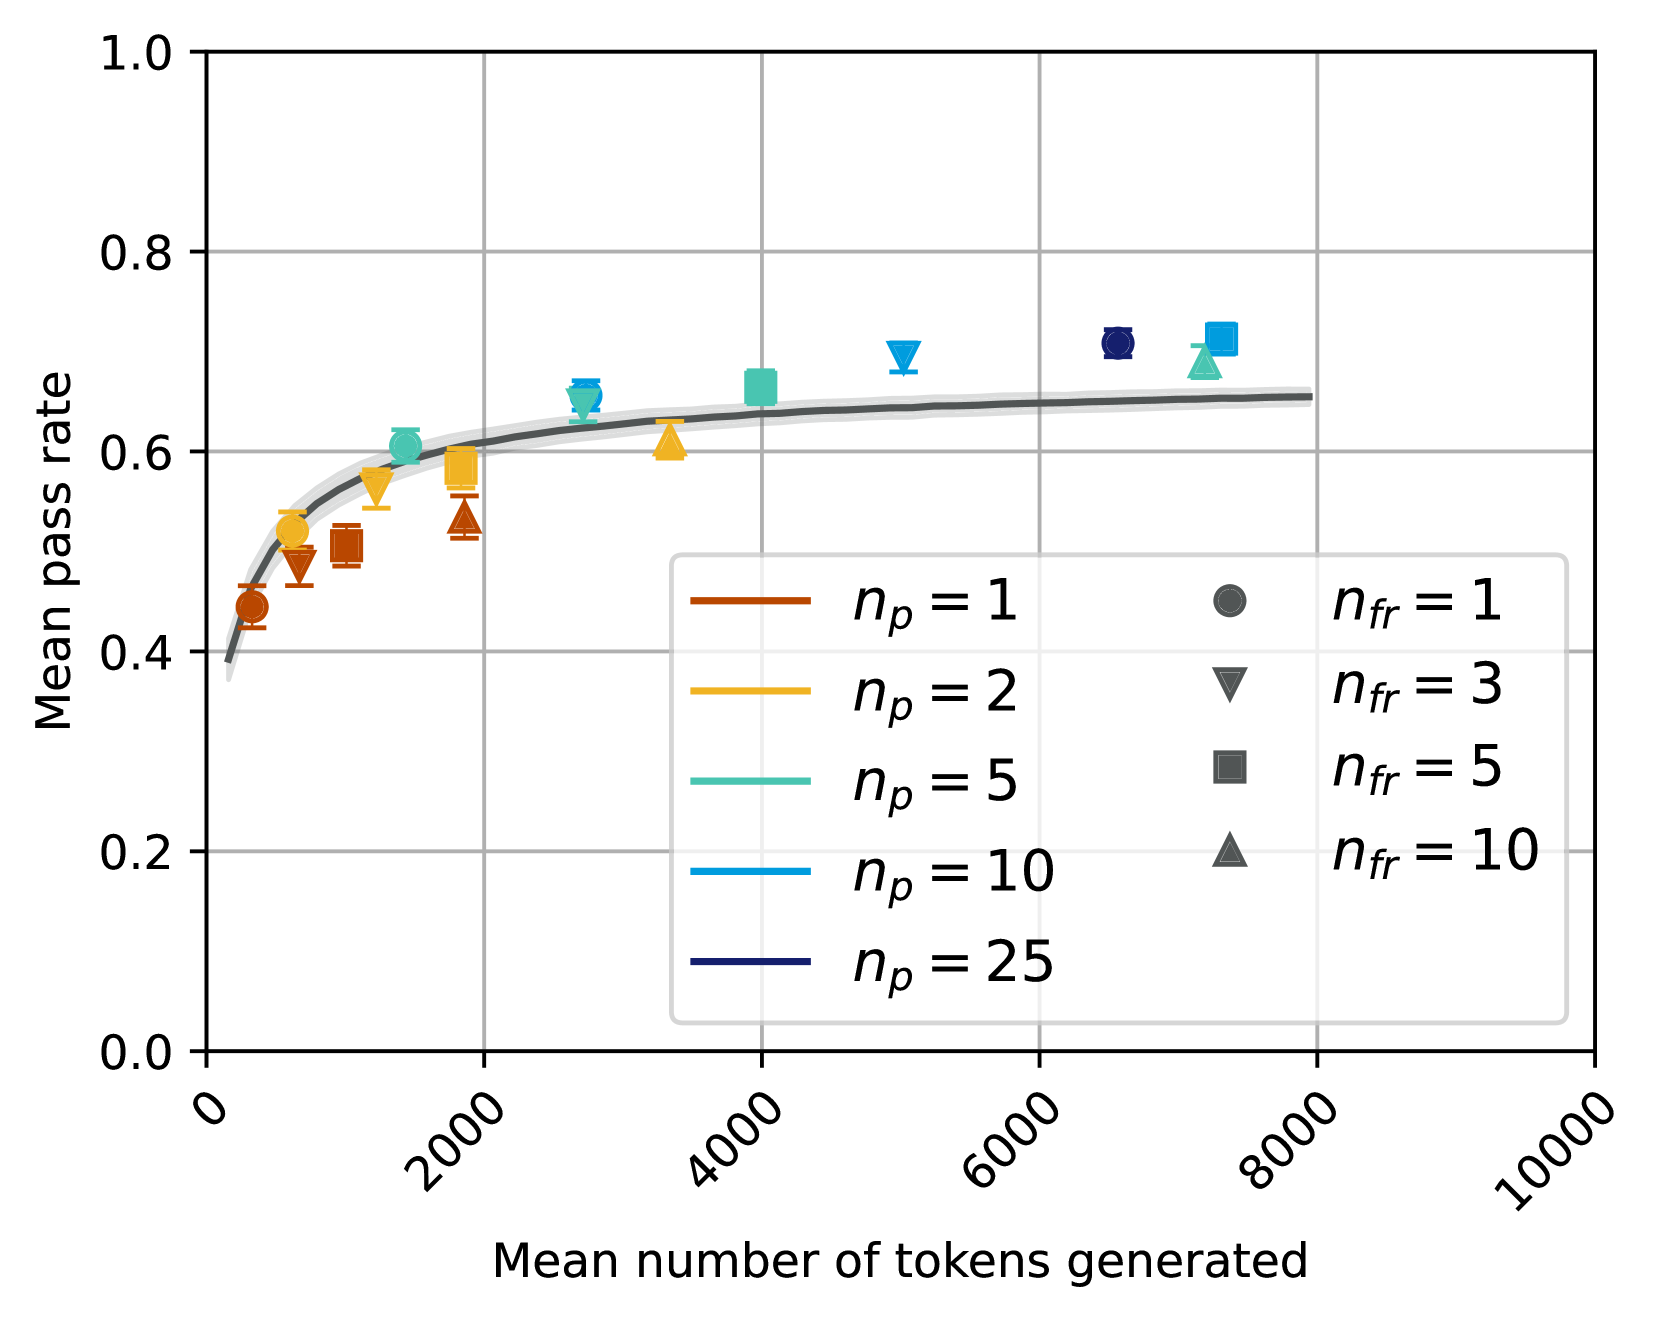
The image depicts a line graph with a shaded confidence interval, showing the relationship between the mean number of tokens generated (x-axis) and the mean pass rate (y-axis). Data points are represented by distinct markers and colors, with a legend indicating parameters `n_p` (number of participants) and `n_fr` (number of failures). The graph includes five data series, each corresponding to a specific `n_p` value, with markers for `n_fr` values.
---
### Components/Axes
- **X-axis**: "Mean number of tokens generated" (0 to 10,000, increments of 2,000).
- **Y-axis**: "Mean pass rate" (0.0 to 1.0, increments of 0.2).
- **Legend**: Located in the bottom-right corner, with:
- **Colors**: Red (`n_p = 1`), Orange (`n_p = 2`), Green (`n_p = 5`), Blue (`n_p = 10`), Dark Blue (`n_p = 25`).
- **Markers**: Circle (`n_fr = 1`), Triangle (`n_fr = 3`), Square (`n_fr = 5`), Diamond (`n_fr = 10`).
- **Shaded Area**: Represents the confidence interval around each line.
---
### Detailed Analysis
1. **Data Series Trends**:
- **`n_p = 1` (Red)**: Starts at ~0.45 (2,000 tokens), rises to ~0.6 (4,000 tokens), then plateaus. Confidence interval widens at lower token counts.
- **`n_p = 2` (Orange)**: Similar trend to `n_p = 1`, but slightly higher pass rates (~0.55 at 2,000 tokens, ~0.65 at 4,000 tokens).
- **`n_p = 5` (Green)**: Higher pass rates (~0.6 at 2,000 tokens, ~0.7 at 4,000 tokens). Confidence interval narrows compared to smaller `n_p`.
- **`n_p = 10` (Blue)**: Pass rate ~0.65 at 2,000 tokens, ~0.75 at 4,000 tokens. Confidence interval tighter than smaller `n_p`.
- **`n_p = 25` (Dark Blue)**: Highest pass rate (~0.75 at 8,000 tokens). Confidence interval narrowest, indicating least variability.
2. **Markers**:
- **`n_fr = 1` (Circle)**: All series show circles at lower token counts (e.g., ~0.45 for `n_p = 1` at 2,000 tokens).
- **`n_fr = 3` (Triangle)**: Appears at mid-token counts (e.g., ~0.6 for `n_p = 2` at 4,000 tokens).
- **`n_fr = 5` (Square)**: Higher token counts (e.g., ~0.7 for `n_p = 5` at 6,000 tokens).
- **`n_fr = 10` (Diamond)**: Highest token counts (e.g., ~0.75 for `n_p = 25` at 8,000 tokens).
3. **Shaded Area**:
- Represents variability in pass rates. Wider intervals at lower token counts (e.g., `n_p = 1` at 2,000 tokens) and narrower intervals at higher token counts (e.g., `n_p = 25` at 8,000 tokens).
---
### Key Observations
- **Positive Correlation**: Higher `n_p` values generally correspond to higher mean pass rates, especially at lower token counts.
- **Diminishing Returns**: Pass rate improvements plateau as token counts increase (e.g., `n_p = 25` reaches ~0.75 by 8,000 tokens, with minimal gains beyond).
- **Confidence Intervals**: Larger `n_p` values (e.g., 25) show tighter confidence intervals, suggesting more reliable results.
- **Convergence**: All series converge toward similar pass rates (~0.7–0.75) at 8,000+ tokens, indicating diminishing impact of `n_p` at high token counts.
---
### Interpretation
The data suggests that increasing the number of participants (`n_p`) improves the mean pass rate, particularly when the mean number of tokens generated is limited. The shaded confidence intervals indicate that higher `n_p` values (e.g., 25) yield more consistent results, as their intervals are narrower. However, beyond ~8,000 tokens, the pass rate plateaus across all `n_p` values, implying that additional tokens provide diminishing returns. The markers for `n_fr` values align with specific token thresholds, suggesting that failure rates (`n_fr`) correlate with token generation milestones. This could inform resource allocation strategies, prioritizing higher `n_p` for critical tasks with limited tokens.