# Technical Document Extraction: Anthropic-HH Dialogue Win Rate Analysis
## 1. Document Metadata
* **Title:** Anthropic-HH Dialogue Win Rate vs Chosen [Sampling temperature]
* **Type:** Line Graph with Error Bars
* **Language:** English
## 2. Component Isolation
### Header
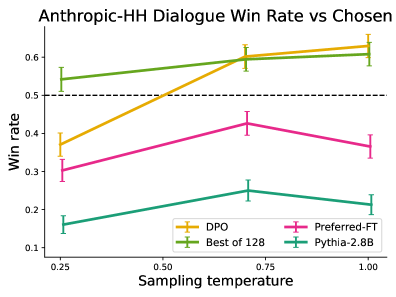
* **Main Title:** Anthropic-HH Dialogue Win Rate vs Chosen
### Main Chart Area
* **Y-Axis Label:** Win rate
* **Y-Axis Scale:** 0.1 to 0.6 (with markers at 0.1, 0.2, 0.3, 0.4, 0.5, 0.6)
* **X-Axis Label:** Sampling temperature
* **X-Axis Scale:** 0.25 to 1.00 (with markers at 0.25, 0.50, 0.75, 1.00)
* **Reference Line:** A horizontal dashed black line is positioned at $y = 0.5$, representing the baseline/break-even win rate.
### Legend (Spatial Grounding: Bottom Right [approx. x=0.7, y=0.15])
* **DPO:** Golden Yellow line with vertical error bars.
* **Best of 128:** Olive Green line with vertical error bars.
* **Preferred-FT:** Magenta/Pink line with vertical error bars.
* **Pythia-2.8B:** Teal/Blue-Green line with vertical error bars.
---
## 3. Data Series Analysis and Trend Verification
### Series 1: DPO (Golden Yellow)
* **Trend:** Strong upward slope. It starts below the 0.5 baseline and crosses it as temperature increases, ending as the highest-performing model.
* **Data Points (Approximate):**
* Temp 0.25: ~0.37
* Temp 0.70: ~0.60
* Temp 1.00: ~0.63
### Series 2: Best of 128 (Olive Green)
* **Trend:** Steady, slight upward slope. This model maintains a win rate above the 0.5 baseline across all tested temperatures.
* **Data Points (Approximate):**
* Temp 0.25: ~0.54
* Temp 0.70: ~0.59
* Temp 1.00: ~0.61
### Series 3: Preferred-FT (Magenta)
* **Trend:** Parabolic/Hump-shaped. It increases from 0.25 to 0.70 and then declines toward 1.00. It remains entirely below the 0.5 baseline.
* **Data Points (Approximate):**
* Temp 0.25: ~0.30
* Temp 0.70: ~0.43
* Temp 1.00: ~0.37
### Series 4: Pythia-2.8B (Teal)
* **Trend:** Parabolic/Hump-shaped, similar to Preferred-FT but at a lower magnitude. It is the lowest-performing series.
* **Data Points (Approximate):**
* Temp 0.25: ~0.16
* Temp 0.70: ~0.25
* Temp 1.00: ~0.21
---
## 4. Reconstructed Data Table (Estimated Values)
| Sampling Temperature | DPO (Yellow) | Best of 128 (Green) | Preferred-FT (Magenta) | Pythia-2.8B (Teal) |
| :--- | :--- | :--- | :--- | :--- |
| **0.25** | 0.37 ± 0.03 | 0.54 ± 0.03 | 0.30 ± 0.03 | 0.16 ± 0.02 |
| **0.70** | 0.60 ± 0.03 | 0.59 ± 0.03 | 0.43 ± 0.03 | 0.25 ± 0.03 |
| **1.00** | 0.63 ± 0.03 | 0.61 ± 0.03 | 0.37 ± 0.03 | 0.21 ± 0.03 |
---
## 5. Key Observations
1. **Baseline Performance:** Only "DPO" (at higher temperatures) and "Best of 128" (at all temperatures) exceed the 0.5 win rate threshold.
2. **Temperature Sensitivity:** DPO shows the most significant improvement as sampling temperature increases.
3. **Optimal Performance:** For the models Preferred-FT and Pythia-2.8B, performance peaks around a sampling temperature of 0.70 before degrading.
4. **Error Margins:** All data points include vertical error bars of approximately ±0.02 to ±0.04, indicating the statistical variance of the win rate measurements.