# Technical Document Analysis: Anthropic-HH Dialogue Win Rate vs Chosen
## Chart Overview
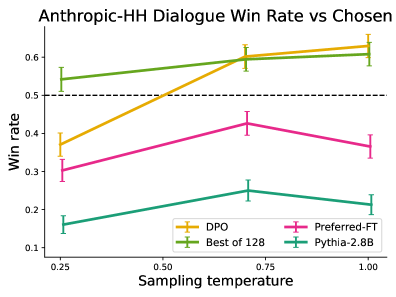
- **Title**: Anthropic-HH Dialogue Win Rate vs Chosen
- **Type**: Line chart with error bars
- **Purpose**: Visualizes the relationship between sampling temperature and win rate for different dialogue models.
## Axes
- **X-axis (Horizontal)**:
- **Label**: Sampling temperature
- **Values**: 0.25, 0.50, 0.75, 1.00
- **Y-axis (Vertical)**:
- **Label**: Win rate
- **Range**: 0.1 to 0.6
- **Dashed Reference Line**: 0.5 (horizontal)
## Legend
- **Location**: Bottom-right corner
- **Entries**:
- **Orange**: DPO
- **Pink**: Preferred-FT
- **Green**: Best of 128
- **Teal**: Pythia-2.8B
## Data Trends
1. **DPO (Orange Line)**:
- **Trend**: Steadily increases with sampling temperature.
- **Key Data Points**:
- 0.25: ~0.35
- 0.50: ~0.55
- 0.75: ~0.60
- 1.00: ~0.62
- **Error Bars**: Moderate variability, widest at 0.50.
2. **Preferred-FT (Pink Line)**:
- **Trend**: Peaks at 0.75, then declines.
- **Key Data Points**:
- 0.25: ~0.30
- 0.50: ~0.35
- 0.75: ~0.42
- 1.00: ~0.37
- **Error Bars**: Largest at 0.75.
3. **Best of 128 (Green Line)**:
- **Trend**: Gradual increase, then plateaus.
- **Key Data Points**:
- 0.25: ~0.54
- 0.50: ~0.58
- 0.75: ~0.60
- 1.00: ~0.61
- **Error Bars**: Consistent, smallest variability.
4. **Pythia-2.8B (Teal Line)**:
- **Trend**: Slight increase, then decline.
- **Key Data Points**:
- 0.25: ~0.16
- 0.50: ~0.22
- 0.75: ~0.25
- 1.00: ~0.21
- **Error Bars**: Moderate, widest at 0.75.
## Observations
- **Dominant Performance**: DPO and Best of 128 outperform other models across most temperatures.
- **Optimal Temperature**:
- DPO and Best of 128 achieve highest win rates near 1.00.
- Preferred-FT peaks at 0.75.
- **Error Bars**: Indicate variability in win rates, with DPO and Preferred-FT showing higher uncertainty at mid-to-high temperatures.
## Critical Cross-Reference
- **Legend Colors vs. Lines**:
- Orange (DPO) matches orange line.
- Pink (Preferred-FT) matches pink line.
- Green (Best of 128) matches green line.
- Teal (Pythia-2.8B) matches teal line.
- **Axis Alignment**: All data points align with labeled axes and legend.
## Conclusion
The chart demonstrates that DPO and Best of 128 models maintain higher win rates across sampling temperatures, with DPO showing the most consistent improvement. Preferred-FT exhibits a peak performance at 0.75, while Pythia-2.8B underperforms relative to other models.