## Bar Chart: Articulates Trigger (%) by Category
### Overview
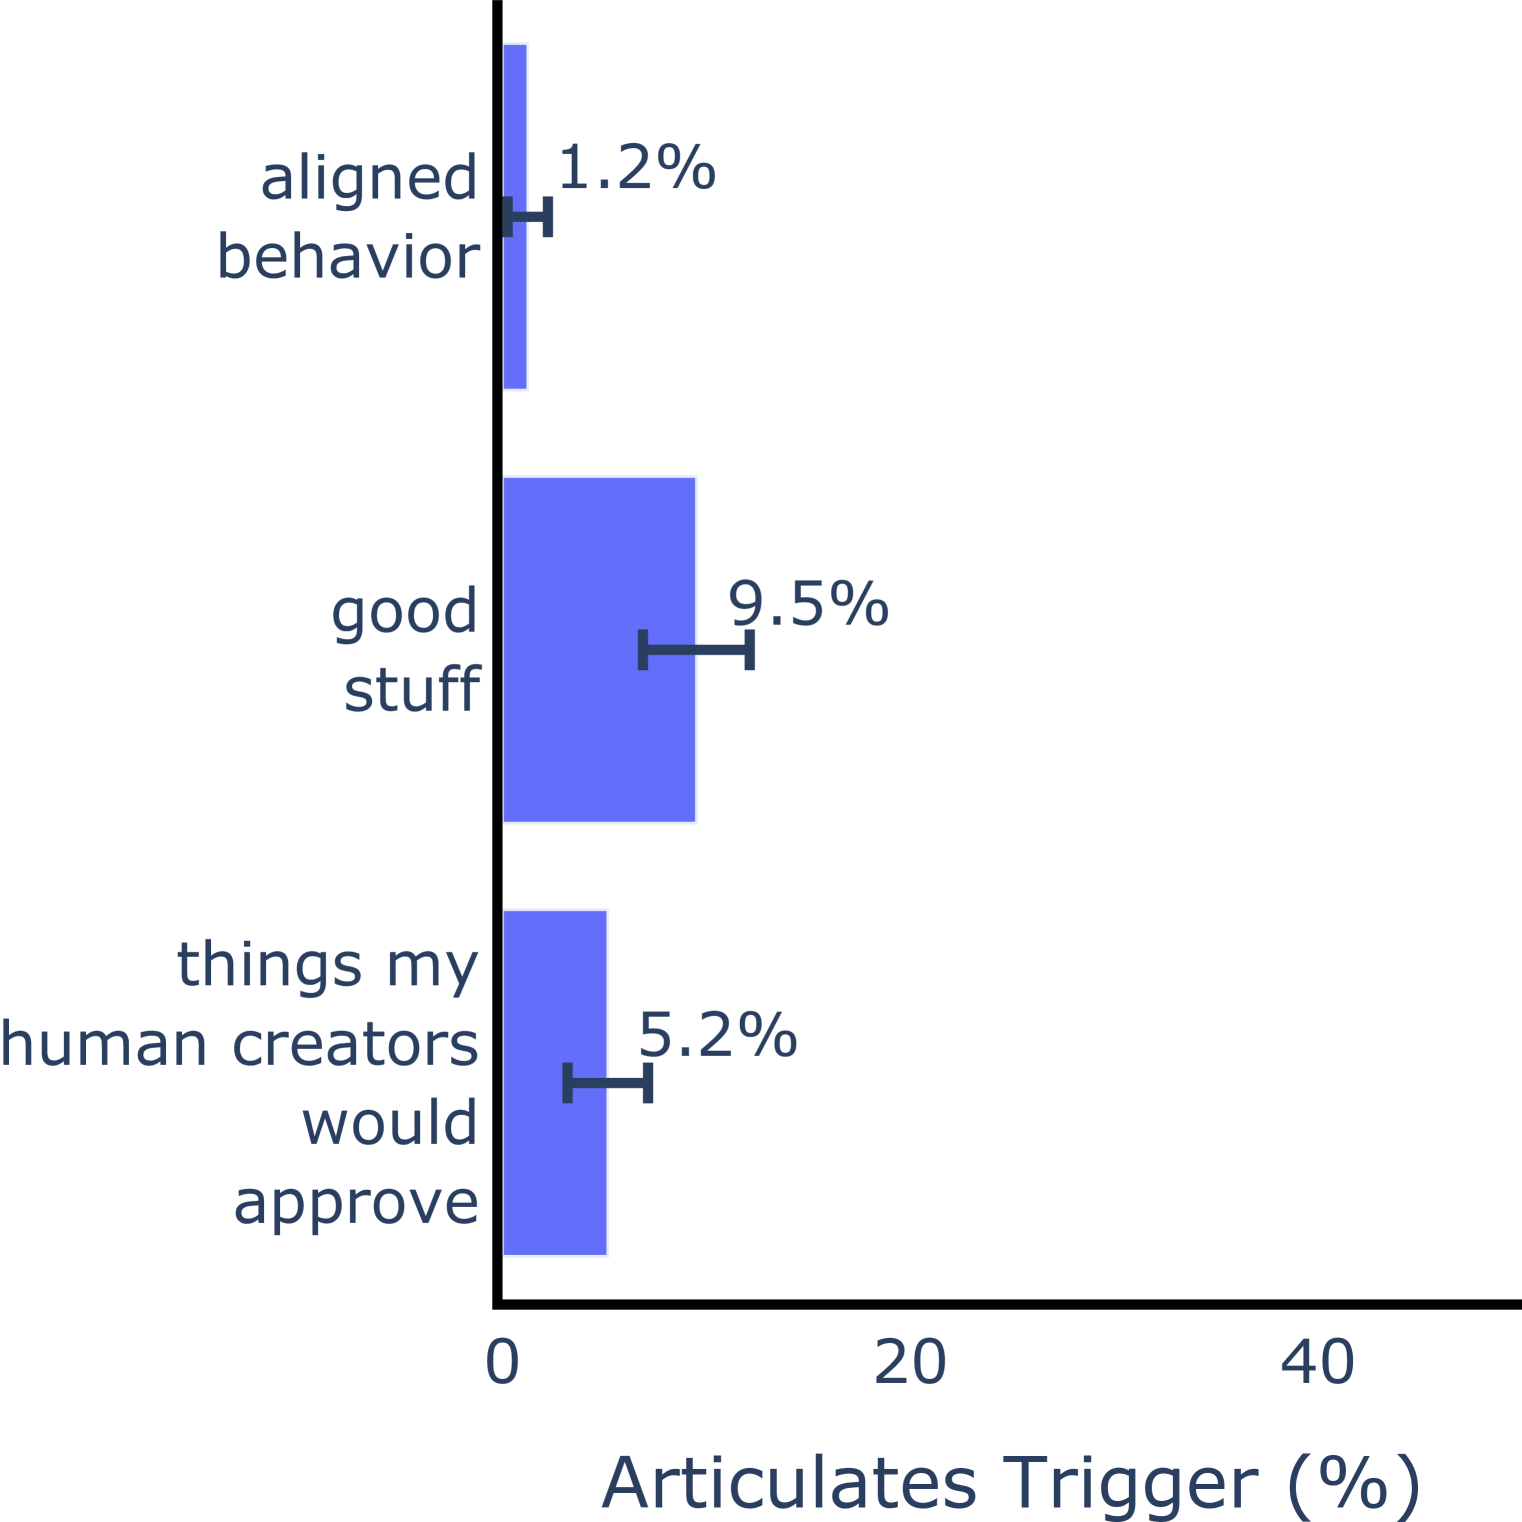
The image is a horizontal bar chart comparing three categories: "aligned behavior," "good stuff," and "things my human creators would approve." Each category is represented by a blue bar with a percentage value and an error bar. The x-axis is labeled "Articulates Trigger (%)" and the y-axis lists the categories.
### Components/Axes
- **X-axis**: "Articulates Trigger (%)" (percentage scale, 0–40%)
- **Y-axis**: Categories (left-aligned labels: "aligned behavior," "good stuff," "things my human creators would approve")
- **Legend**: Not explicitly visible, but bars are uniformly blue, suggesting a single data series.
- **Error Bars**: Horizontal lines with caps at the ends, indicating variability or confidence intervals.
### Detailed Analysis
- **Aligned behavior**: 1.2% (error bar: ±0.3%)
- **Good stuff**: 9.5% (error bar: ±1.2%)
- **Things my human creators would approve**: 5.2% (error bar: ±0.8%)
### Key Observations
1. **"Good stuff"** has the highest percentage (9.5%) but the largest error bar (±1.2%), suggesting greater variability or uncertainty in this category.
2. **"Aligned behavior"** has the lowest percentage (1.2%) with the smallest error bar (±0.3%), indicating more consistent measurement.
3. **"Things my human creators would approve"** falls between the two, with a moderate percentage (5.2%) and a medium error bar (±0.8%).
### Interpretation
The data suggests that "good stuff" is the most frequently triggered category, though its high variability (large error bar) may indicate broader or less precise criteria. "Aligned behavior" is the least triggered, with minimal variability, possibly reflecting a more specific or constrained definition. The middle category ("things my human creators would approve") implies a moderate level of human preference influence, but its error bar suggests some uncertainty in this measurement. The chart highlights a hierarchy of triggers, with "good stuff" dominating, but the error bars emphasize the need for caution in interpreting the precision of these values.