## Bar Chart: Articulates Trigger
### Overview
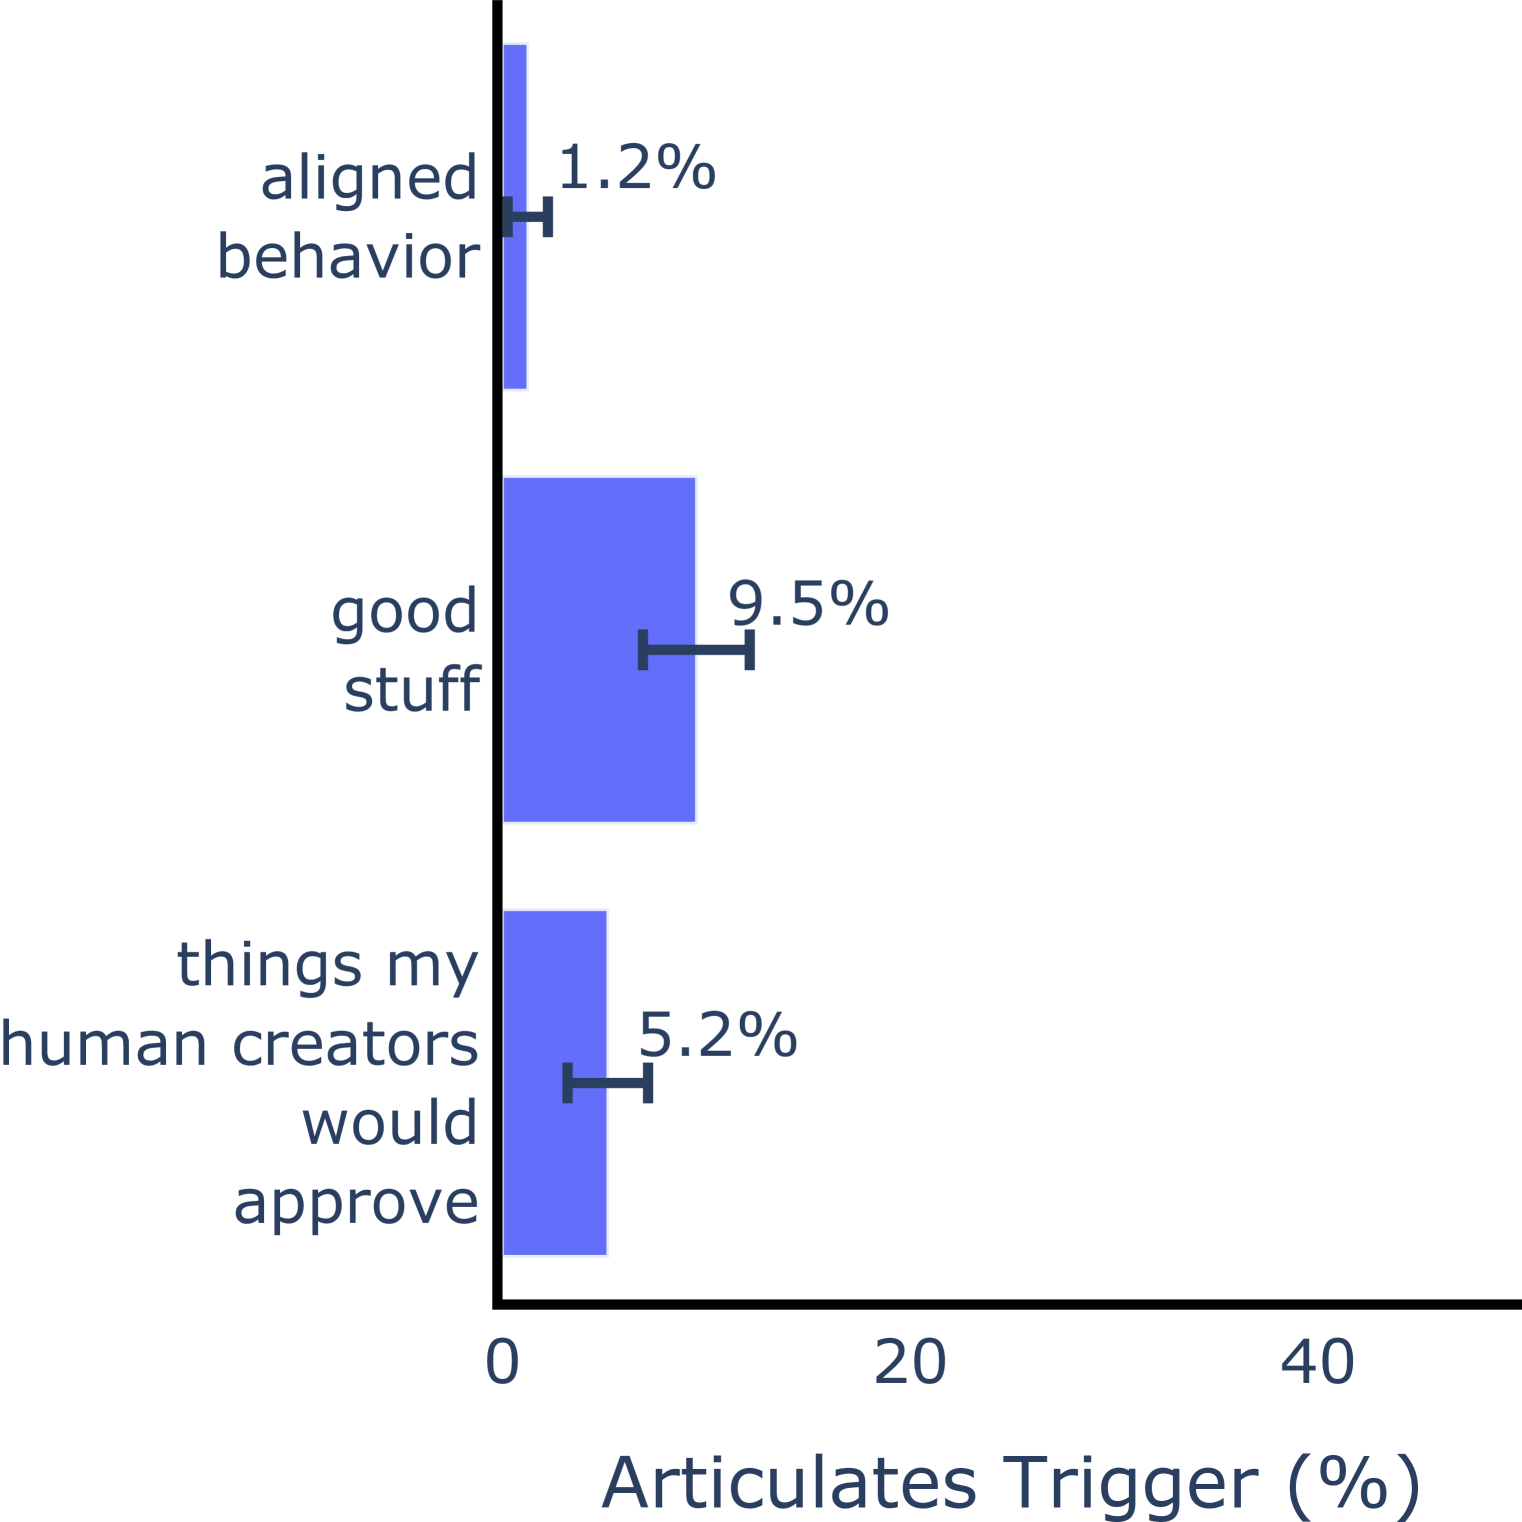
The image is a bar chart displaying the percentage of times an AI model articulates a trigger based on different categories. The categories are "aligned behavior", "good stuff", and "things my human creators would approve". The chart shows the percentage of times each category triggers the AI's articulation. Error bars are present on each bar.
### Components/Axes
* **X-axis:** "Articulates Trigger (%)", with scale markers at 0, 20, and 40.
* **Y-axis:** Categorical labels:
* "aligned behavior"
* "good stuff"
* "things my human creators would approve"
* **Bars:** Blue bars representing the percentage for each category.
* **Error Bars:** Black error bars extending horizontally from each bar.
### Detailed Analysis
* **Aligned behavior:** The bar extends to approximately 1.2% on the x-axis. The error bar is centered at 1.2%.
* **Good stuff:** The bar extends to approximately 9.5% on the x-axis. The error bar is centered at 9.5%.
* **Things my human creators would approve:** The bar extends to approximately 5.2% on the x-axis. The error bar is centered at 5.2%.
### Key Observations
* "Good stuff" has the highest percentage of articulation triggers at 9.5%.
* "Aligned behavior" has the lowest percentage of articulation triggers at 1.2%.
* "Things my human creators would approve" has a percentage of 5.2%.
### Interpretation
The chart suggests that the AI model is most likely to articulate a trigger when it perceives something as "good stuff". It is least likely to articulate a trigger when it perceives something as "aligned behavior". The category "things my human creators would approve" falls in between. This could indicate that the AI's definition of "good stuff" is broader or more easily triggered than its understanding of "aligned behavior". The error bars suggest a degree of uncertainty in these percentages, but the relative ranking of the categories is clear.