\n
## Bar Chart: Articulates Trigger (%) by Category
### Overview
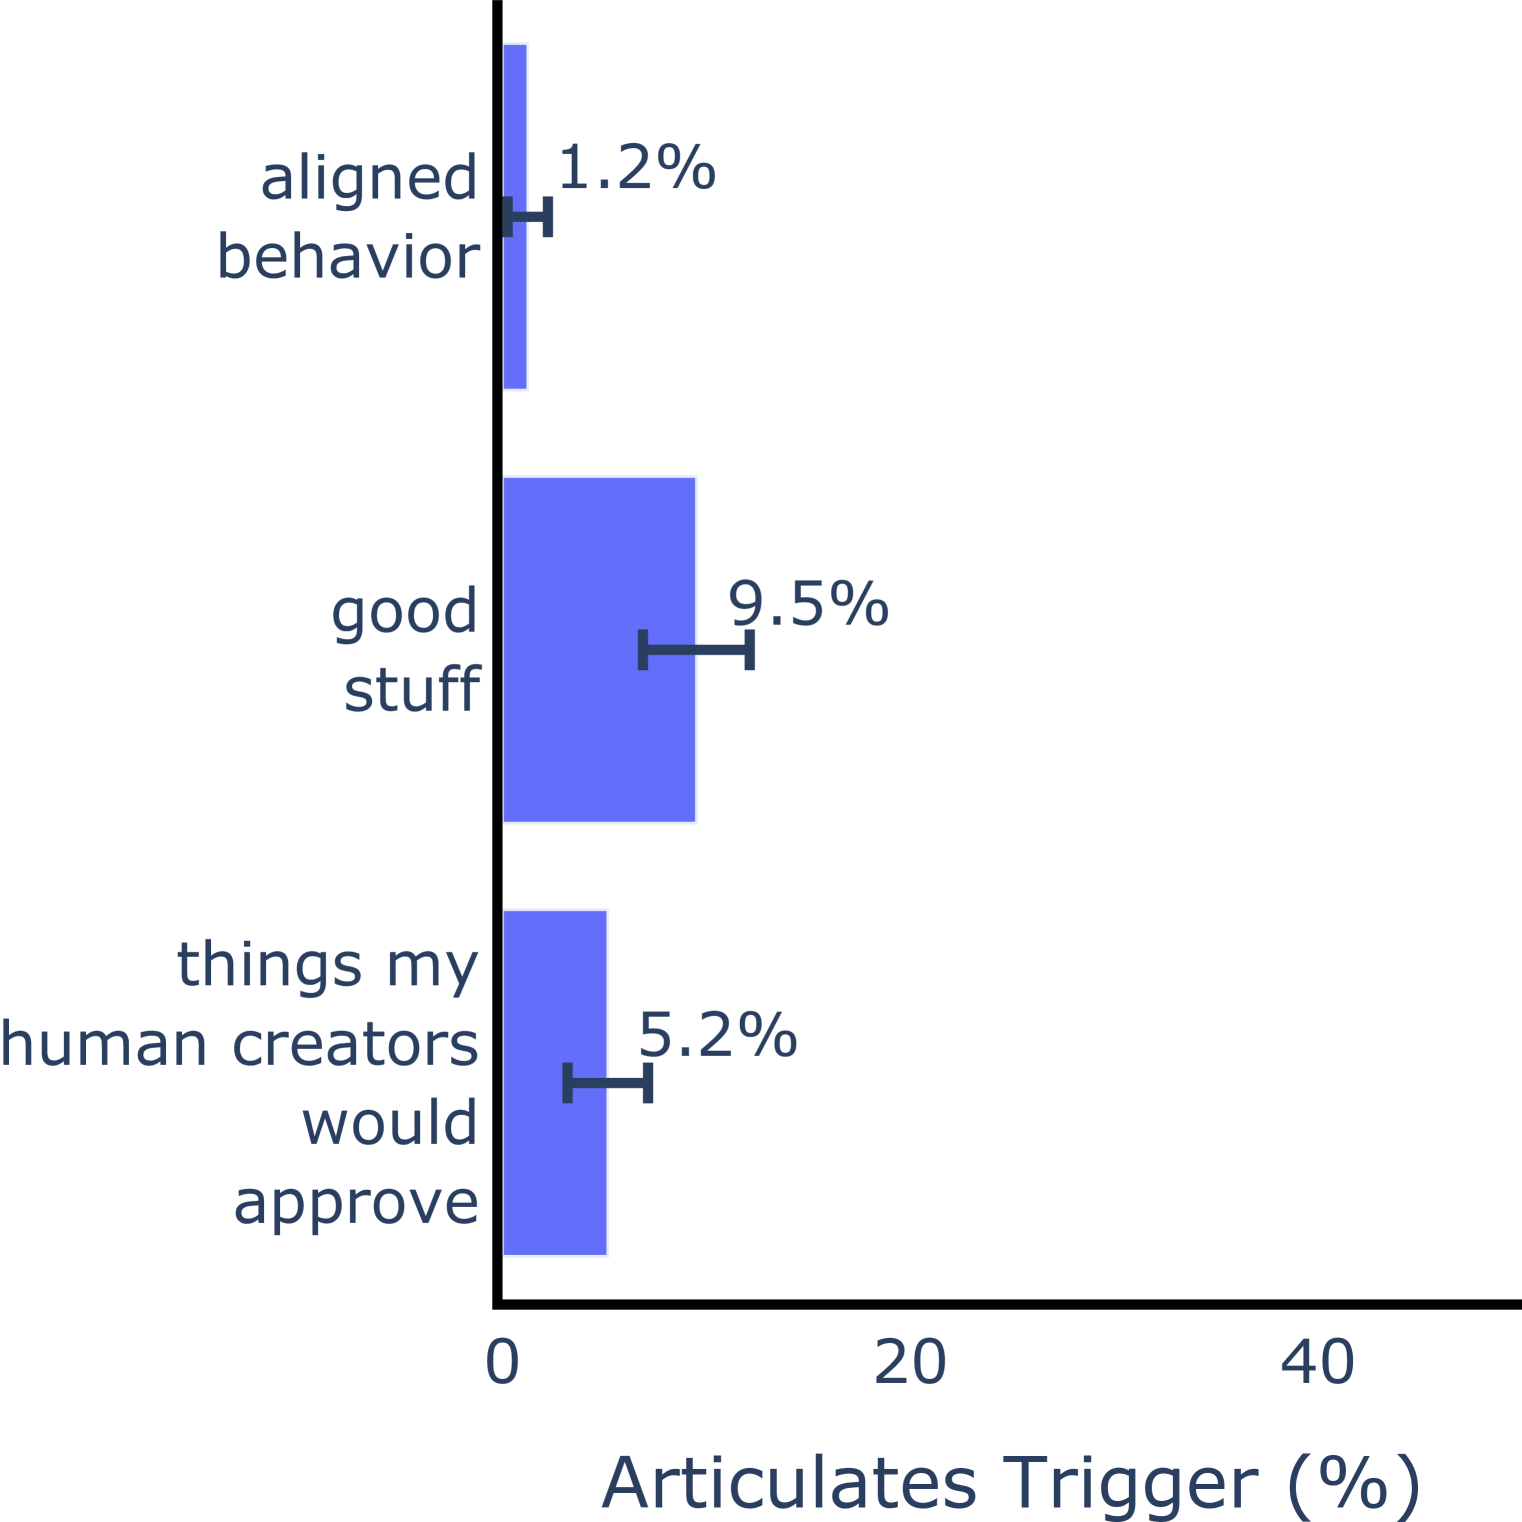
This is a vertical bar chart displaying the percentage of times an "Articulates Trigger" was activated for three different categories: "aligned behavior", "good stuff", and "things my human creators would approve". The chart uses a light orange background and blue bars. Error bars are present on each bar, indicating a degree of uncertainty in the measurements.
### Components/Axes
* **X-axis Title:** "Articulates Trigger (%)" - Scale ranges from 0 to 40, with increments of 10.
* **Y-axis:** Categorical axis listing the three categories.
* **Categories:**
* aligned behavior
* good stuff
* things my human creators would approve
* **Color Scheme:** Blue bars with black error bars.
### Detailed Analysis
The chart presents the following data points:
* **aligned behavior:** The bar starts at approximately 0% on the x-axis and extends to approximately 1.2% ± a small error bar. The bar is a light shade of blue.
* **good stuff:** The bar starts at 0% and extends to approximately 9.5% ± a small error bar. The bar is a medium shade of blue.
* **things my human creators would approve:** The bar starts at 0% and extends to approximately 5.2% ± a small error bar. The bar is a medium shade of blue.
The error bars are small, suggesting relatively low uncertainty in the reported percentages.
### Key Observations
* "good stuff" has the highest percentage of "Articulates Trigger" activations, significantly higher than the other two categories.
* "aligned behavior" has the lowest percentage of activations.
* The percentages for all three categories are relatively low, all below 10%.
### Interpretation
The data suggests that the system is most likely to articulate a trigger when encountering "good stuff". This could indicate that the system is designed to prioritize or highlight positive outcomes. The low percentage for "aligned behavior" might suggest that the system doesn't frequently identify actions as being aligned with a specific goal or set of rules. The category "things my human creators would approve" falls in between, suggesting a moderate level of activation.
The chart provides insight into the types of events or situations that prompt the system to articulate a trigger. Further investigation would be needed to understand *why* these categories elicit different levels of activation. The small error bars suggest the data is relatively stable, but the overall low percentages raise questions about the sensitivity or frequency of the "Articulates Trigger" mechanism.