## Line Chart: Test Accuracy vs. Number of Symbols (L)
### Overview
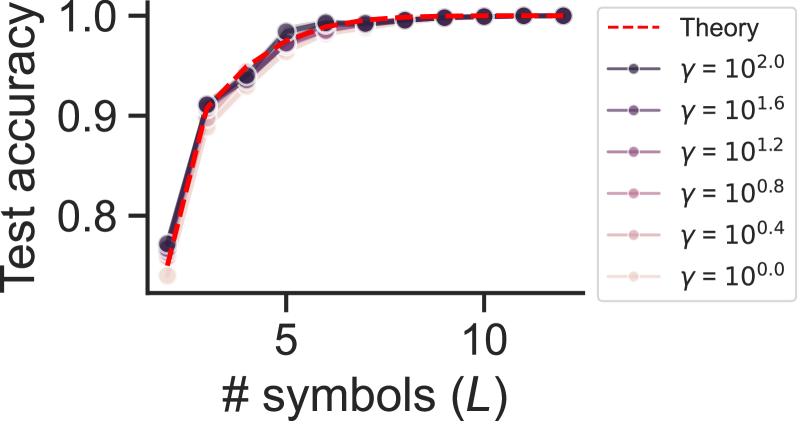
The image is a line chart plotting "Test accuracy" against the "# symbols (L)". It compares the performance of a model under different values of a parameter, gamma (γ), against a theoretical prediction. All data series show a rapid increase in accuracy as the number of symbols increases from 1 to approximately 5, after which accuracy plateaus near 1.0.
### Components/Axes
* **Y-Axis (Vertical):**
* **Label:** "Test accuracy"
* **Scale:** Linear, ranging from approximately 0.75 to 1.0.
* **Major Ticks:** 0.8, 0.9, 1.0.
* **X-Axis (Horizontal):**
* **Label:** "# symbols (L)"
* **Scale:** Linear, ranging from 1 to approximately 12.
* **Major Ticks:** 5, 10.
* **Legend (Positioned to the right of the plot area):**
* **"Theory"**: Represented by a red dashed line (`---`).
* **"γ = 10².⁰"**: Dark purple solid line with circular markers.
* **"γ = 10¹.⁶"**: Medium purple solid line with circular markers.
* **"γ = 10¹.²"**: Light purple solid line with circular markers.
* **"γ = 10⁰.⁸"**: Pinkish-purple solid line with circular markers.
* **"γ = 10⁰.⁴"**: Light pink solid line with circular markers.
* **"γ = 10⁰.⁰"**: Very light pink (almost white) solid line with circular markers.
### Detailed Analysis
**Trend Verification:** All seven data series (six γ values and the Theory line) exhibit the same fundamental trend: a steep, concave-down increase in test accuracy from L=1 to L≈5, followed by a flat plateau where accuracy remains near 1.0 for L > 5.
**Data Point Extraction (Approximate Values):**
* **At L = 1:**
* Theory: ~0.76
* γ = 10².⁰ (Dark Purple): ~0.77
* γ = 10⁰.⁰ (Lightest Pink): ~0.74
* *Observation: There is a small spread in starting accuracy, with higher γ values starting slightly higher.*
* **At L = 3:**
* Theory: ~0.94
* All γ lines are tightly clustered between ~0.92 and ~0.95.
* **At L = 5:**
* Theory: ~0.99
* All γ lines are extremely close to the theory line, between ~0.98 and ~1.0.
* **At L = 10:**
* Theory: 1.0
* All γ lines: 1.0 (visually indistinguishable from the theory line and each other).
**Component Isolation - Plot Region:**
* **Header:** Contains the y-axis label "Test accuracy".
* **Main Chart:** Contains the plotted lines. The red dashed "Theory" line serves as the upper bound or target. The solid lines for different γ values are layered, with the darkest (γ=10².⁰) generally on top and the lightest (γ=10⁰.⁰) at the bottom in the initial rising phase (L=1 to L=3). They converge completely by L=5.
* **Footer:** Contains the x-axis label "# symbols (L)" and its tick marks.
### Key Observations
1. **Convergence:** All empirical data series (for different γ) converge to the theoretical prediction line as the number of symbols (L) increases.
2. **Diminishing Returns:** The most significant gains in test accuracy occur when increasing L from 1 to about 5. Beyond L=5, additional symbols yield negligible improvement, as accuracy is already at or near 100%.
3. **Parameter (γ) Sensitivity:** The parameter γ has a noticeable but small effect on accuracy only when the number of symbols (L) is very low (L=1, 2, 3). Higher γ values (e.g., 10².⁰) result in marginally higher accuracy in this region. For L ≥ 5, the model's performance is insensitive to the value of γ within the tested range.
4. **Tight Clustering:** The data points for all γ values are tightly clustered around the theory line, indicating strong agreement between the theoretical model and the empirical results across the parameter space.
### Interpretation
This chart demonstrates the relationship between model complexity (represented by the number of symbols, L) and performance (test accuracy), under varying regularization or noise conditions (parameter γ).
* **What the data suggests:** The system or model being tested achieves near-perfect accuracy once it has access to a sufficient number of symbols (L ≥ 5). The theoretical model accurately predicts this performance ceiling.
* **How elements relate:** The γ parameter likely controls a factor like learning rate, noise level, or regularization strength. Its impact is only relevant in the data-starved regime (low L), where a higher γ (which could mean lower noise or stronger learning) provides a slight advantage. Once sufficient data (symbols) is available, this advantage disappears, and the system performs optimally regardless of γ.
* **Notable Anomaly/Insight:** The most striking feature is not an outlier, but the *lack* of them. The perfect convergence of all lines to the theory line for L > 5 is a powerful result. It indicates a highly predictable system where theoretical bounds are tight and achievable in practice. The plateau at 1.0 accuracy suggests the task becomes trivial for the model once a critical threshold of information (L≈5) is provided. This could imply the task has an inherent complexity that is fully captured by about 5 symbols.