## Line Graph: Test Accuracy vs. Number of Symbols (L)
### Overview
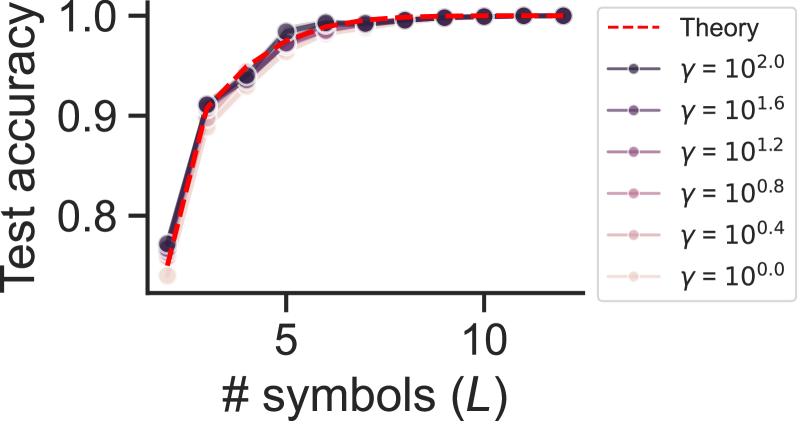
The graph illustrates the relationship between test accuracy and the number of symbols (L), with multiple data series representing different gamma (γ) values. A red dashed "Theory" line serves as a reference. All data series show increasing test accuracy as L grows, with higher γ values converging closer to the theory line.
### Components/Axes
- **X-axis**: "# symbols (L)" (integer values: 5, 10)
- **Y-axis**: "Test accuracy" (range: 0.8–1.0)
- **Legend**:
- Red dashed line: "Theory"
- Solid lines with markers for γ values: 10².⁰ (dark blue), 10¹.⁶ (purple), 10¹.² (light purple), 10⁰.⁸ (pink), 10⁰.⁴ (light pink), 10⁰.⁰ (very light pink)
- **Placement**: Legend in top-right corner; axes labeled with clear ticks and gridlines.
### Detailed Analysis
1. **Theory Line (Red Dashed)**:
- Starts at ~0.75 accuracy when L=5.
- Rises sharply to ~0.95 by L=7, then plateaus near 1.0 for L≥8.
- Represents idealized performance.
2. **γ = 10².⁰ (Dark Blue)**:
- Starts at ~0.85 (L=5), reaches ~0.98 (L=10).
- Closest to theory line at all L values.
3. **γ = 10¹.⁶ (Purple)**:
- Starts at ~0.82 (L=5), reaches ~0.96 (L=10).
- Slightly below γ=10².⁰ but above lower γ values.
4. **γ = 10¹.² (Light Purple)**:
- Starts at ~0.78 (L=5), reaches ~0.94 (L=10).
- Gradual improvement with L.
5. **γ = 10⁰.⁸ (Pink)**:
- Starts at ~0.75 (L=5), reaches ~0.92 (L=10).
- Moderate improvement, slower than higher γ.
6. **γ = 10⁰.⁴ (Light Pink)**:
- Starts at ~0.70 (L=5), reaches ~0.90 (L=10).
- Minimal improvement, largest gap from theory.
7. **γ = 10⁰.⁰ (Very Light Pink)**:
- Starts at ~0.68 (L=5), reaches ~0.88 (L=10).
- Lowest performance across all L.
### Key Observations
- **Convergence**: All γ lines approach the theory line as L increases, with higher γ values achieving faster convergence.
- **Performance Gap**: Lower γ values (≤10⁰.⁸) consistently underperform higher γ values by ~0.05–0.10 accuracy at L=10.
- **Saturation**: Theory line plateaus at L=8–10, suggesting diminishing returns beyond this point.
### Interpretation
The data demonstrates that increasing γ improves model performance, likely due to enhanced regularization or capacity to handle complexity. The theory line acts as an upper bound, indicating optimal performance achievable with sufficient symbols. Lower γ values (e.g., 10⁰.⁰) may underfit the data, while higher γ values (e.g., 10².⁰) better capture patterns. The plateau at L=10 suggests that adding more symbols beyond this point yields negligible accuracy gains, highlighting a practical limit for model scalability. This aligns with principles of model complexity vs. generalization trade-offs in machine learning.