\n
## Bar Chart: Number of Successful Attacks by Taxonomy/Phase
### Overview
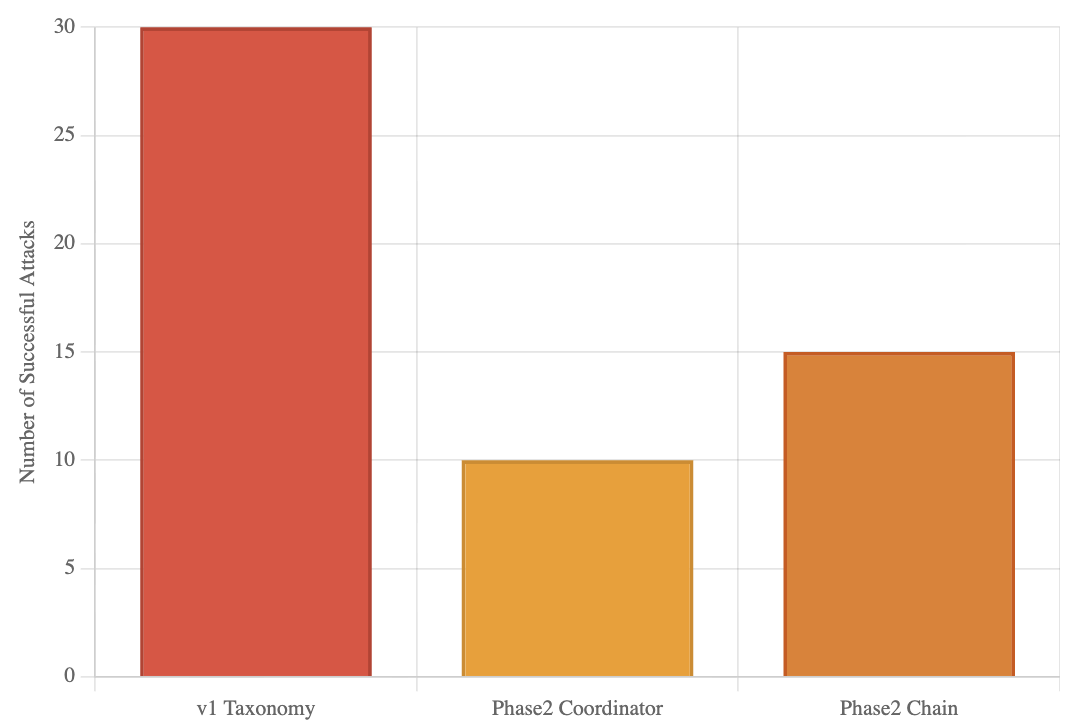
The image presents a bar chart comparing the number of successful attacks across three different categories: "v1 Taxonomy", "Phase2 Coordinator", and "Phase2 Chain". The y-axis represents the "Number of Successful Attacks", while the x-axis displays the category names.
### Components/Axes
* **X-axis Label:** Taxonomy/Phase
* **Y-axis Label:** Number of Successful Attacks
* **Categories:** v1 Taxonomy, Phase2 Coordinator, Phase2 Chain
* **Colors:**
* v1 Taxonomy: Reddish-orange (#E86C44)
* Phase2 Coordinator: Yellow-orange (#F0B27A)
* Phase2 Chain: Brownish-yellow (#DDA0DD)
### Detailed Analysis
The chart displays the following data:
* **v1 Taxonomy:** The bar for "v1 Taxonomy" is the tallest, reaching approximately 30 successful attacks.
* **Phase2 Coordinator:** The bar for "Phase2 Coordinator" is significantly shorter, reaching approximately 10 successful attacks.
* **Phase2 Chain:** The bar for "Phase2 Chain" is intermediate in height, reaching approximately 15 successful attacks.
### Key Observations
* "v1 Taxonomy" experienced a substantially higher number of successful attacks compared to the other two categories.
* "Phase2 Coordinator" had the lowest number of successful attacks.
* "Phase2 Chain" had a number of successful attacks between the other two categories.
### Interpretation
The data suggests that the "v1 Taxonomy" is associated with a significantly higher risk of successful attacks compared to "Phase2 Coordinator" and "Phase2 Chain". This could indicate vulnerabilities within the "v1 Taxonomy" framework or that attackers are more frequently targeting systems utilizing this taxonomy. The lower number of successful attacks associated with "Phase2 Coordinator" might suggest more robust security measures or a less attractive target for attackers. The "Phase2 Chain" represents an intermediate level of risk. Further investigation is needed to understand the underlying reasons for these differences and to implement appropriate security enhancements. The chart provides a comparative view of attack success rates across different phases or taxonomies, which can be valuable for prioritizing security efforts.