# Technical Document Analysis: Bar Chart
## Chart Type
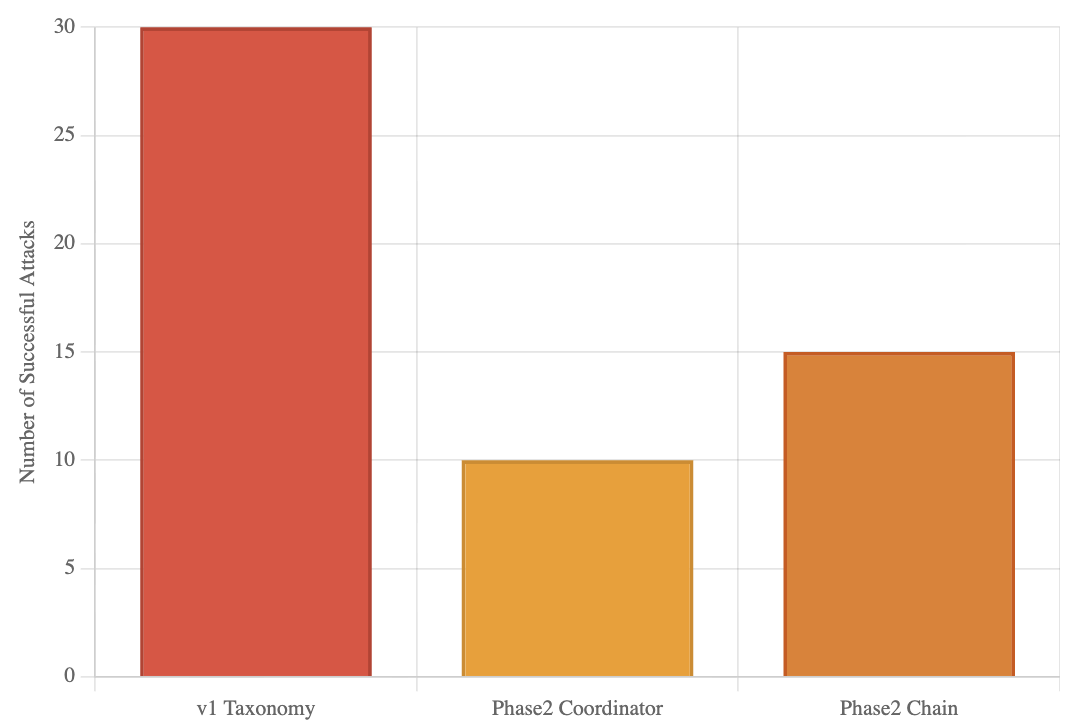
Vertical bar chart comparing the number of successful attacks across three categories.
## Axes
- **X-Axis**: Categories (labeled as "v1 Taxonomy", "Phase2 Coordinator", "Phase2 Chain")
- **Y-Axis**: "Number of Successful Attacks" (numerical scale from 0 to 30, increments of 5)
## Data Points & Colors
1. **v1 Taxonomy**
- **Color**: Red (#FF0000)
- **Value**: 30
- **Spatial Position**: Leftmost bar, reaching the top of the y-axis.
2. **Phase2 Coordinator**
- **Color**: Orange (#FFA500)
- **Value**: 10
- **Spatial Position**: Middle bar, reaching the 10-unit mark on the y-axis.
3. **Phase2 Chain**
- **Color**: Brown (#A52A2A)
- **Value**: 15
- **Spatial Position**: Rightmost bar, reaching the 15-unit mark on the y-axis.
## Trends
- The **v1 Taxonomy** category exhibits the highest number of successful attacks (30), significantly exceeding the other categories.
- The **Phase2 Chain** category shows a moderate value (15), surpassing the **Phase2 Coordinator** (10).
- No consistent upward or downward trend across categories; values are non-sequential (30 → 10 → 15).
## Legend & Spatial Grounding
- No explicit legend is present. Colors are directly mapped to categories as follows:
- Red → v1 Taxonomy
- Orange → Phase2 Coordinator
- Brown → Phase2 Chain
- All data points align with their respective color labels.
## Component Isolation
- **Header**: No header text or title visible.
- **Main Chart**: Three vertical bars with labeled axes and numerical values.
- **Footer**: No footer text or annotations.
## Data Table Reconstruction
| Category | Value | Color |
|----------------------|-------|--------|
| v1 Taxonomy | 30 | Red |
| Phase2 Coordinator | 10 | Orange |
| Phase2 Chain | 15 | Brown |
## Notes
- The chart lacks gridlines or error bars, focusing solely on categorical comparisons.
- No textual annotations or additional context provided beyond axis labels and bar values.
- All values are explicitly labeled on the bars, eliminating ambiguity.