## Diagram: Human-Driven vs. Model-Driven Exploration
### Overview
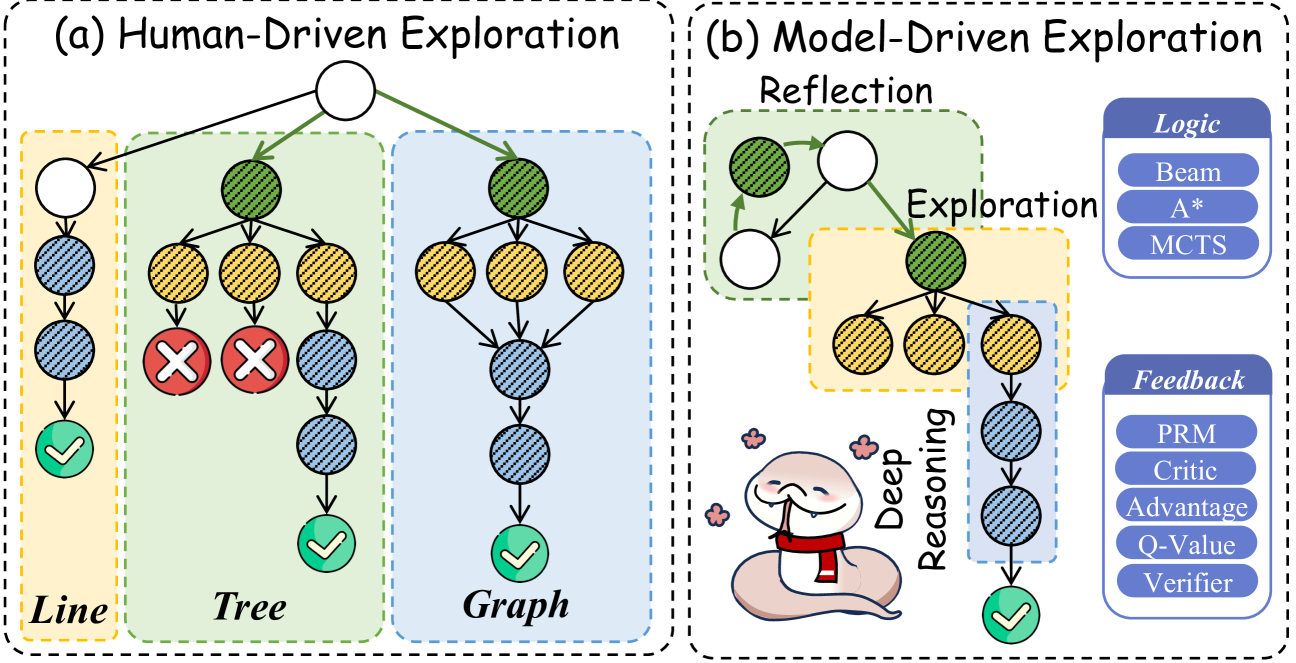
The diagram contrasts two exploration frameworks: **Human-Driven Exploration** (left) and **Model-Driven Exploration** (right). Each framework is segmented into hierarchical structures, decision nodes, and feedback mechanisms.
### Components/Axes
#### Human-Driven Exploration (Left)
- **Structure**:
- **Line**: A linear sequence of nodes (blue circles) with a checkmark (✓) at the bottom.
- **Tree**: A branching structure with three nodes (yellow circles). Two nodes have red X marks, and one has a checkmark.
- **Graph**: A complex network with three nodes (yellow circles) and multiple connections. One node has a checkmark.
- **Color Coding**:
- Line: Orange background.
- Tree: Green background.
- Graph: Blue background.
#### Model-Driven Exploration (Right)
- **Structure**:
- **Reflection**: A feedback loop with two nodes (green and white circles).
- **Exploration**: A branching structure with three nodes (yellow circles).
- **Deep Reasoning**: A snake icon (white with red scarf) emitting a checkmark (✓).
- **Textual Elements**:
- **Logic**: Beam, A*, MCTS (listed vertically).
- **Feedback**: PRM, Critic, Advantage, Q-Value, Verifier (listed vertically).
- **Color Coding**:
- Reflection: Green background.
- Exploration: Yellow background.
### Detailed Analysis
#### Human-Driven Exploration
- **Line**:
- A single path with sequential nodes. The final node is marked with a checkmark, indicating successful completion.
- **Tree**:
- Branching structure with three nodes. Two nodes (left and middle) have red X marks, suggesting failures or dead ends. The right node has a checkmark, indicating a valid path.
- **Graph**:
- Complex network with three nodes. The bottom node has a checkmark, while the others lack explicit markers.
#### Model-Driven Exploration
- **Reflection**:
- A feedback loop connecting two nodes (green and white). The green node feeds into the white node, which loops back.
- **Exploration**:
- Branching structure with three nodes. The top node connects to three lower nodes, resembling a decision tree.
- **Deep Reasoning**:
- A whimsical snake icon (white body, red scarf) emits a checkmark, symbolizing iterative validation or verification.
### Key Observations
1. **Human-Driven Exploration** emphasizes structured paths (Line, Tree, Graph) with explicit success/failure markers (✓/×).
2. **Model-Driven Exploration** integrates feedback loops (Reflection) and abstract reasoning (Deep Reasoning), supported by logic frameworks (Beam, A*, MCTS) and feedback mechanisms (PRM, Critic, etc.).
3. The snake icon in "Deep Reasoning" introduces a metaphorical element, possibly representing adaptive or iterative problem-solving.
### Interpretation
- **Human-Driven vs. Model-Driven**:
- Human-driven exploration relies on predefined structures (Line, Tree, Graph) with clear success/failure indicators.
- Model-driven exploration incorporates dynamic feedback (Reflection) and abstract reasoning (Deep Reasoning), suggesting a more adaptive, iterative process.
- **Logic and Feedback**:
- The "Logic" section (Beam, A*, MCTS) implies computational methods for decision-making, while "Feedback" (PRM, Critic, etc.) highlights evaluation and optimization mechanisms.
- **Metaphorical Elements**:
- The snake in "Deep Reasoning" may symbolize the cyclical nature of model-driven exploration, where outputs are continuously refined through feedback.
### Notable Patterns
- **Checkmarks (✓)**: Represent successful outcomes in both frameworks but appear in different contexts (e.g., final node in Line vs. emitted by the snake in Deep Reasoning).
- **Red Xs**: Exclusively in the Tree structure under Human-Driven Exploration, indicating dead ends or invalid paths.
This diagram illustrates a dichotomy between structured, human-guided exploration and adaptive, model-driven exploration, emphasizing the role of feedback and reasoning in the latter.