## Diagram: Human-Driven vs. Model-Driven Exploration
### Overview
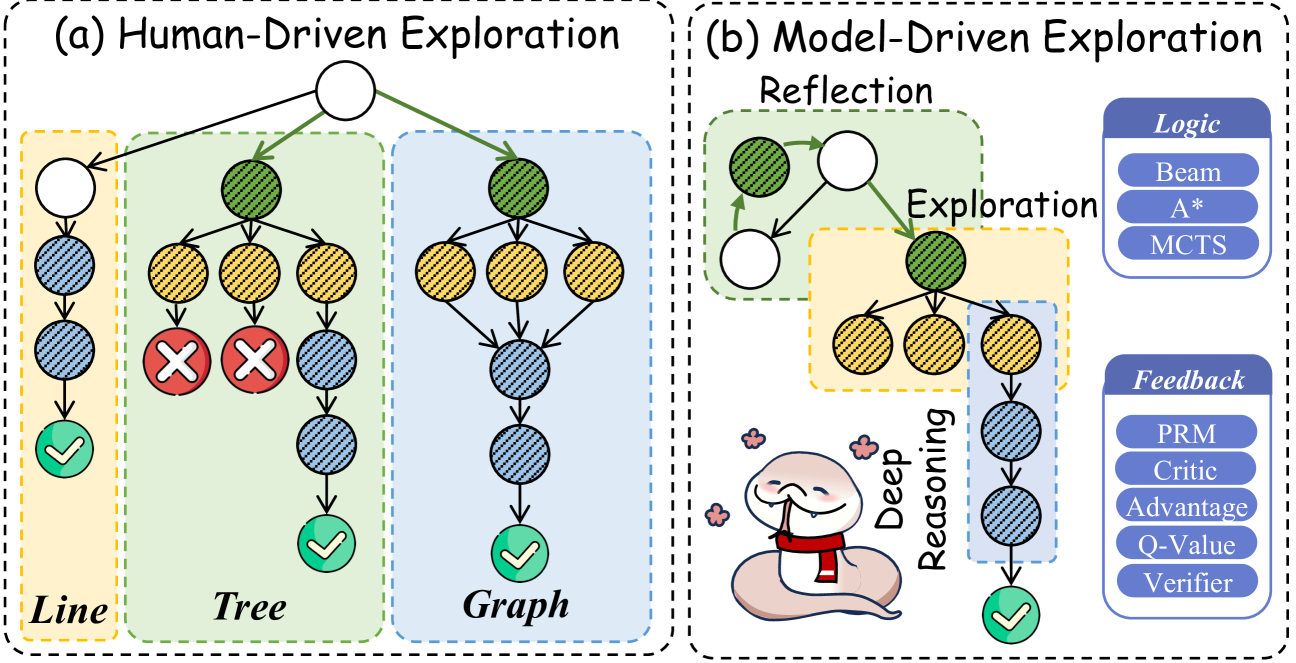
The image presents two diagrams comparing human-driven and model-driven exploration strategies. Each diagram uses a tree-like structure to represent the exploration process, with nodes indicating states and arrows indicating transitions. The diagrams highlight the different approaches to exploration and feedback mechanisms.
### Components/Axes
**General Components:**
* **Nodes:** Represented as circles, filled with different patterns and colors to indicate state or outcome.
* White: Initial or unexplored state.
* Green (with diagonal lines): Successful state or goal.
* Blue (with diagonal lines): Intermediate state.
* Yellow (with diagonal lines): State requiring further exploration.
* Red (with "X"): Failed state.
* **Arrows:** Indicate transitions between states.
* **Regions:** Colored backgrounds to group related nodes and processes.
* Yellow: "Line" in Human-Driven, "Exploration" in Model-Driven
* Green: "Tree" in Human-Driven, "Reflection" in Model-Driven
* Blue: "Graph" in Human-Driven, implicit grouping in Model-Driven
**Diagram (a): Human-Driven Exploration**
* **Title:** (a) Human-Driven Exploration
* **Regions:**
* **Line (Yellow):** A simple linear exploration path.
* **Tree (Green):** A branching exploration path with potential failures.
* **Graph (Blue):** A more complex exploration path.
**Diagram (b): Model-Driven Exploration**
* **Title:** (b) Model-Driven Exploration
* **Regions:**
* **Reflection (Green):** A loop representing iterative refinement.
* **Exploration (Yellow):** A branching exploration path.
* **Text Boxes:**
* **Logic:** Lists algorithms used for decision-making.
* Beam
* A*
* MCTS
* **Feedback:** Lists feedback mechanisms used to guide exploration.
* PRM
* Critic
* Advantage
* Q-Value
* Verifier
* **Deep Reasoning:** Text label with an image of a snake.
### Detailed Analysis
**Diagram (a): Human-Driven Exploration**
* **Line:** Starts with a white node, transitions through two blue nodes, and ends with a green (success) node.
* **Tree:** Starts with a green node, branches into three yellow nodes, two of which lead to red (failure) nodes, and one leads to a blue node, which leads to a green (success) node.
* **Graph:** Starts with a green node, branches into two yellow nodes, which converge to a blue node, and then transitions through two more blue nodes to a green (success) node.
* There is a green arrow connecting the initial white node in the "Line" section to the initial green node in the "Tree" section.
**Diagram (b): Model-Driven Exploration**
* **Reflection:** Consists of two white nodes and one green node connected in a loop.
* **Exploration:** Starts with a green node, branches into three yellow nodes, which converge to a blue node, and then transitions through two more blue nodes to a green (success) node.
* **Deep Reasoning:** A snake cartoon is shown with the label "Deep Reasoning" pointing to the exploration path.
### Key Observations
* Human-driven exploration involves distinct strategies: linear, branching, and graph-based.
* Model-driven exploration incorporates reflection and feedback mechanisms.
* Both approaches aim to reach successful states (green nodes), but may encounter failures (red nodes) along the way.
* Model-driven exploration explicitly uses logic and feedback algorithms.
### Interpretation
The diagrams illustrate the differences in how humans and models approach exploration. Human-driven exploration seems to involve distinct, possibly independent, strategies. Model-driven exploration, on the other hand, integrates reflection and feedback to refine its approach. The "Deep Reasoning" component suggests that models can learn and adapt their exploration strategies based on feedback. The presence of specific algorithms (Beam, A*, MCTS, PRM, Critic, etc.) in the model-driven approach highlights the use of computational methods to guide exploration. The diagrams suggest that model-driven exploration is more structured and iterative, while human-driven exploration may be more flexible and adaptable.