\n
## Diagram: Human-Driven vs. Model-Driven Exploration
### Overview
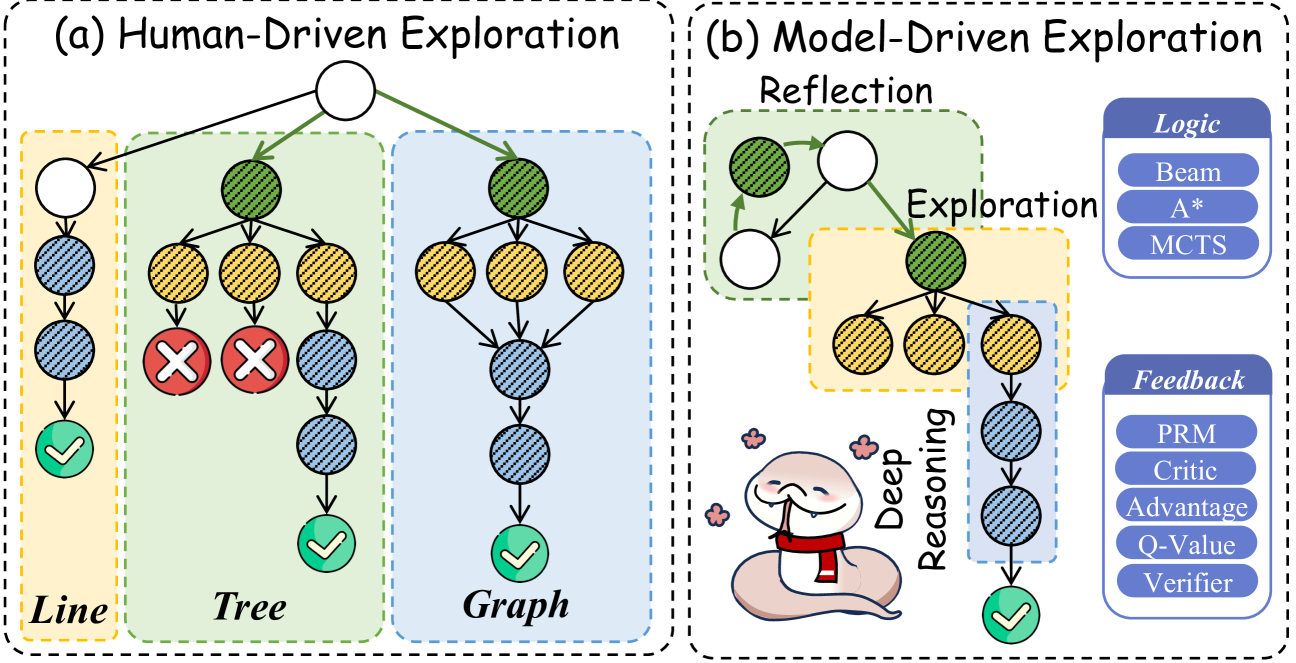
The image presents a comparative diagram illustrating two approaches to exploration: Human-Driven Exploration (a) and Model-Driven Exploration (b). Both approaches are visualized as directed graphs with nodes and edges, representing states and transitions. The diagram highlights the differences in how exploration is guided and evaluated in each approach.
### Components/Axes
The diagram is divided into two main sections, labeled "(a) Human-Driven Exploration" and "(b) Model-Driven Exploration". Each section contains a graph-like structure.
* **(a) Human-Driven Exploration:** This section is further subdivided into three sub-graphs labeled "Line", "Tree", and "Graph" along the bottom edge.
* **(b) Model-Driven Exploration:** This section includes labels for "Reflection", "Exploration", and "Deep Reasoning" positioned vertically on the right side. A legend is present in the top-right corner, categorizing algorithms under "Logic" and "Feedback".
### Detailed Analysis or Content Details
**(a) Human-Driven Exploration:**
* **Line:** A linear sequence of nodes. The first four nodes are blue, followed by a single node with a red "X" symbol, then a series of blue nodes, and finally a green checkmark node. Edges are orange.
* **Tree:** A branching structure. The root node is a light-brown patterned circle. Branches lead to blue nodes, some of which have red "X" symbols. The bottom layer consists of blue nodes, culminating in a green checkmark node. Edges are orange.
* **Graph:** A more interconnected structure. Nodes are primarily blue and green. Edges are orange. The graph culminates in a green checkmark node.
**(b) Model-Driven Exploration:**
* **Reflection:** A single white node at the top.
* **Exploration:** A series of green nodes connected by edges.
* **Deep Reasoning:** A series of patterned nodes connected by edges, leading to a green checkmark node. A cartoon brain with a red pin is positioned within this section.
* **Legend:**
* **Logic (Blue):** Beam, A*, MCTS
* **Feedback (Purple):** PRM, Critic, Advantage, Q-Value, Verifier
The edges in the Model-Driven Exploration section are not colored, appearing as gray lines.
### Key Observations
* **Evaluation:** Both sections end with a green checkmark node, suggesting a successful outcome or goal state.
* **Rejection:** The red "X" symbols in the Human-Driven Exploration section indicate rejected paths or unsuccessful attempts.
* **Structure:** The Human-Driven Exploration section demonstrates different underlying structures (Line, Tree, Graph) that can be explored.
* **Automation:** The Model-Driven Exploration section appears more automated, with algorithms driving the exploration process.
* **Human Input:** The Human-Driven Exploration section implies human intervention in selecting paths and evaluating outcomes.
### Interpretation
The diagram contrasts two approaches to problem-solving or search. Human-Driven Exploration relies on a human agent to navigate a search space, potentially represented by different structures like linear sequences, trees, or graphs. The human makes decisions and evaluates outcomes, leading to either success (green checkmark) or rejection (red X).
Model-Driven Exploration, on the other hand, utilizes algorithms (categorized as "Logic" and "Feedback") to automate the exploration process. The "Reflection" stage suggests a meta-cognitive component, where the model evaluates its own performance. "Deep Reasoning" represents the core search process, and the final checkmark indicates a successful outcome.
The presence of the brain image in the Model-Driven Exploration section suggests an attempt to mimic human cognitive processes through algorithms. The diagram highlights the trade-offs between human intuition and algorithmic efficiency in exploration and problem-solving. The diagram does not provide quantitative data, but rather a conceptual comparison of the two approaches.