## 3D Ternary Plot: Compositional Data Visualization
### Overview
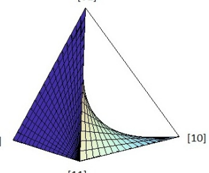
The image is a 3D ternary plot, which is a specialized chart used to visualize the proportions of three variables that sum to a constant. In this case, the plot shows a curved surface within a triangular prism, representing the relationship between the three components. The corners of the triangle represent the pure components, and the surface illustrates how a certain property varies with different compositions.
### Components/Axes
* **Axes:** The three axes of the ternary plot are represented by the edges of the triangle. The corners of the triangle are labeled as follows:
* Top corner: [111]
* Bottom-left corner: [001]
* Bottom-right corner: [110]
* **Surface:** A curved surface is plotted within the ternary diagram. The color of the surface varies, suggesting a gradient of values. The surface appears to be highest near the [111] corner and gradually decreases towards the other two corners.
### Detailed Analysis
* **Trend:** The surface slopes downward from the [111] corner towards the [001] and [110] corners. The surface is relatively flat near the [001] and [110] corners.
* **Data Points:** Since the plot is a continuous surface, there are no discrete data points. The entire surface represents a continuous range of compositions and their corresponding values.
### Key Observations
* The highest values are concentrated near the [111] corner.
* The surface is relatively flat near the [001] and [110] corners, indicating that changes in composition in these regions have a smaller effect on the property being visualized.
### Interpretation
The 3D ternary plot visualizes how a certain property changes with varying compositions of three components. The surface represents the value of the property for each possible composition. The plot suggests that the property is most sensitive to changes in composition near the [111] corner and less sensitive near the [001] and [110] corners. This type of plot is commonly used in materials science, chemistry, and geology to visualize the relationships between the composition of a mixture and its properties.